> For the complete documentation index, see [llms.txt](https://docs.ingestlabs.com/llms.txt). Markdown versions of documentation pages are available by appending `.md` to page URLs; this page is available as [Markdown](https://docs.ingestlabs.com/tag-manager/live-debugging.md).
# Live Debugging
## Introduction
The Live Debugging feature in Ingest Labs displays all the tags that are triggered in real-time on a particular page. You can perform live debugging for both the server-side tags and browser-side tags. The event data is populated in the live debugging section.
## **Procedure**
There are two environments present:
* **Production** – When elements are pushed to the production environment, you can check the live details in the production environment.
* **Staging** – When elements are pushed to the staging environment, you can check the live details in the staging environment.
**Step 1:** Select **Production** from the drop-down.
**Note**: When elements are pushed to the staging environment, you can check the live details in the staging environment.
**Step 2:** Click the **Start Debugging** button.
**Step 3:** The **Start Live Debugging** popup window opens. Without entering a Debug ID, click **Start**.
**Step 4:** The ***Live mode*** option is displayed with a red dot indicator. You can view all the events firing in real-time traffic on the website.
**Step 4.1**: To stop debugging, click the ***Live mode*** drop-down and select **Stop Debugging.**
**Step 4.2:** To clear the debugging session, click the ***Live mode*** drop-down and select **Clear**.
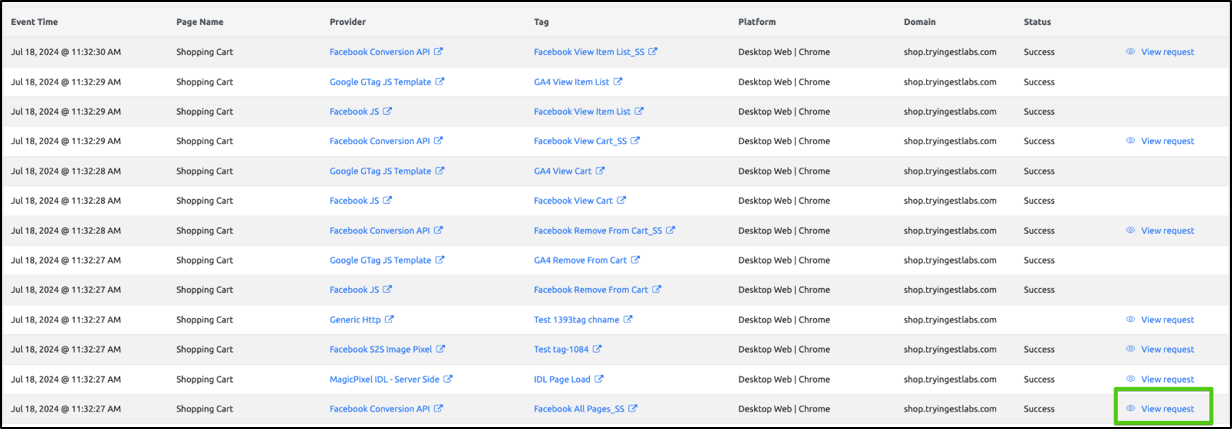
**Step 5:** Click on **View request** of any SS tag to view API call request/response body.
**Step 5.1:** The ***Tag Request Details*** popup window opens. You can view the following tag details:
* **Tag URL** – displays the tag URL.
* **Tag URL Query Parameters Assignment** – displays the query parameters associated with the tag.
**Step 5.2:** Click **Data Elements** to view the data element details.
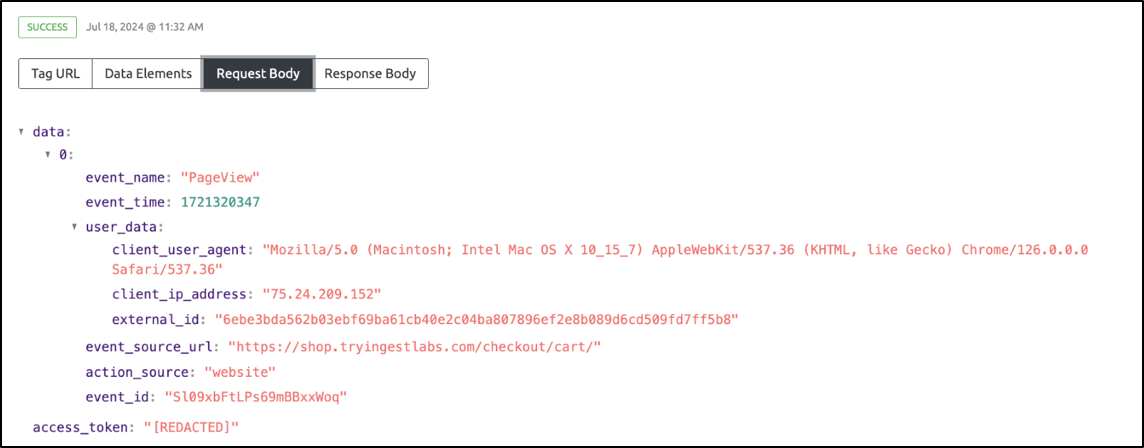
**Step 5.3:** Click **Request Body** to view the details of the request body.
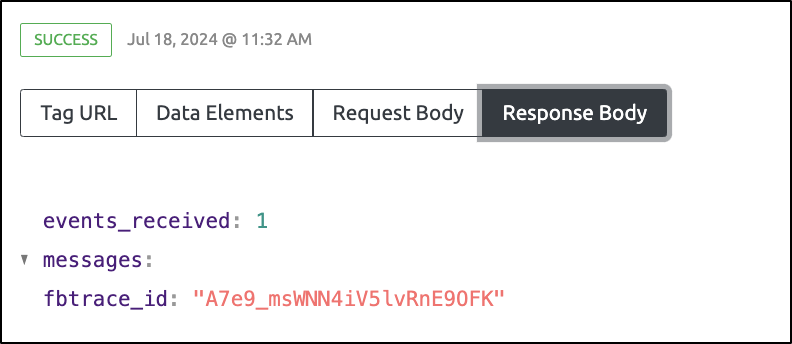
**Step 5.4:** Click **Response Body** to view the details of the response body.
The following are the additional fields that appear on the *Live Debugging* screen.
| Field Name | Description |
| -------------- | ------------------------------------------------------------------------------------- |
| **Event Time** | Displays the event time-stamp. |
| **Page Name** | The page from which the tag is triggered. |
| **Provider** | Displays the Provider details. |
| **Tag** | Displays the Tag details. |
| **Platform** | Displays the Platform from which the page is accessed. |
| **Domain** | Shows the domain from which the tag is triggered. |
| **Status** | Displays the tag status, indicating whether the tag is successfully triggered or not. |
**Note 1:** You can perform the Live Debugging in two ways, either through the console or through a Live Debugging session on Ingest Labs.
**Note 2:** Use the pagination control at the bottom of the page to navigate through multiple pages. The current page is highlighted in blue.
**Step 6**: Click **Add Filter**. The *Add Filter* panel opens on the right side
**Step 6.1:** Under **Field,** click ***Select Field*** drop-down and choose the required field.
**Step 6.2:** Under **Operator**, click the *Select an Operator* drop-down. You will see two options:
* is one of
* is not one of
**Step 6.3:** After selecting an operator, a list opens. Select one or multiple values as needed.
**Step 6.4:** Click **Add Filter** to apply the filter.
**Note:** Click **Cancel** to close the panel without saving any changes.
{% embed url="" %}
## Related Topics
The Live Debugging section includes the following topics:
* [Retrieve the Debug ID Using Console](/tag-manager/live-debugging/retrieve-the-debug-id-using-console.md)
* [Use IngestLabs Debugging session](/tag-manager/live-debugging/view-requests-from-a-live-debugging-session.md)
* [Filter the Events During Live Debugging](/tag-manager/live-debugging/filter-the-events-during-live-debugging.md)
---
# Agent Instructions
This documentation is published with GitBook. GitBook is the documentation platform designed so that both humans and AI agents can read, navigate, and reason over technical content effectively. Learn more at gitbook.com.
## Querying This Documentation
If you need additional information that is not directly available in this page, you can query the documentation dynamically by asking a question.
Perform an HTTP GET request on the current page URL with the `ask` query parameter:
```
GET https://docs.ingestlabs.com/tag-manager/live-debugging.md?ask=
```
The question should be specific, self-contained, and written in natural language.
The response will contain a direct answer to the question and relevant excerpts and sources from the documentation.
Use this mechanism when the answer is not explicitly present in the current page, you need clarification or additional context, or you want to retrieve related documentation sections.