> For the complete documentation index, see [llms.txt](https://docs.ingestlabs.com/llms.txt). Markdown versions of documentation pages are available by appending `.md` to page URLs; this page is available as [Markdown](https://docs.ingestlabs.com/tag-manager/alarms/add-a-new-alarm-tag-anomaly-detection-alarm.md).
# Add a New Alarm (Tag Anomaly Detection Alarm)
## Introduction
You can create a new Tag Anomaly Detection Alarm to monitor unusual tag activity.
## Procedure
To add a new Tag Anomaly Detection Alarm, perform the following steps:
**Step 1:** Select **Alarms** from the left navigation panel.
**Step 2:** Click **Add Alarm** on the top-right corner of the screen.
**Step 3:** Select the **Tag Anomaly Detection Alarm**.
**Step 4:** In the **Name** field, enter the alarm name, and in the **Description** field, enter a brief description of the alarm.
**Step 5:** Under **Environment**, click the **Select Environment** dropdown. Two options are available — **Production** and **Staging**. Click the appropriate option.
**Step 6:** Enter the details mentioned in the **Settings** section.
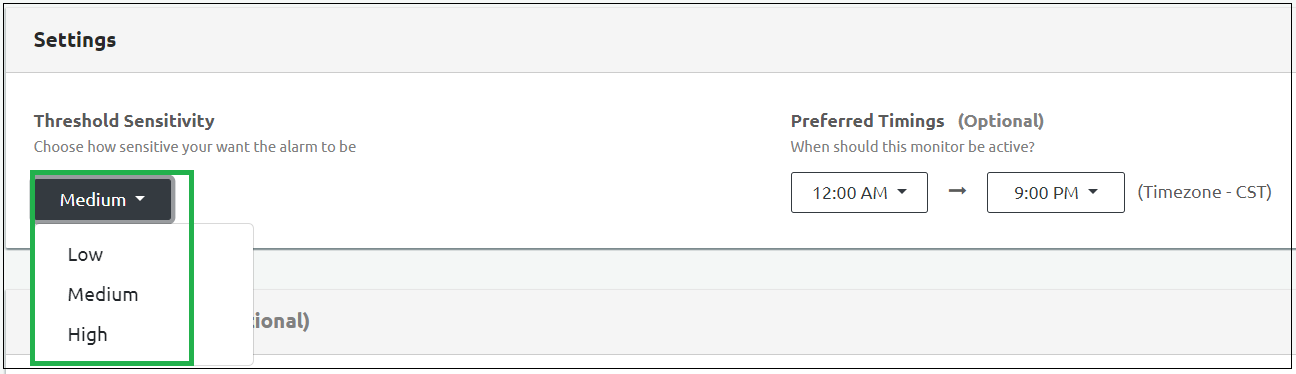
**Threshold Sensitivity:**
* **High** sensitivity: The anomaly detection trigger will fire and send alert if it detects an anomaly at least ONCE in the previous hour.
* **Medium** sensitivity: The anomaly detection trigger will fire and send alert if it detects an anomaly once in the past 2 consecutive hours.
* **Low** sensitivity: The anomaly detection trigger will fire and send alert if it detects an anomaly once in the past 3 consecutive hours.
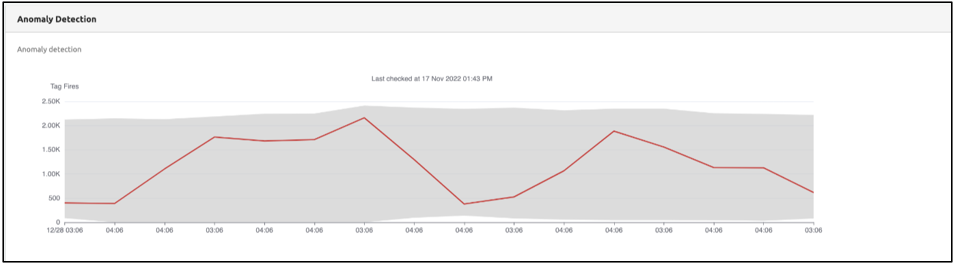
The Tag behavior is determined using the Bollinger Band.
**Preferred Timings:**
Select the exact tag monitoring period from the **Preferred Timings** drop-down. This is an optional setting. For example, If there is a sudden spike in traffic in the evenings, you could set the preferred timing from 5 p.m. to 10 p.m. The tag firing activities will be monitored every evening between 5 p.m. to 10 p.m.
**Note:** The tags are monitored continuously with a set preferred timing.
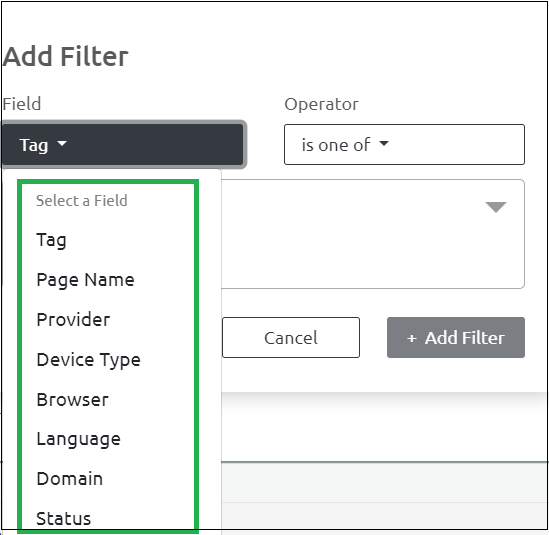
**Step 6:** Enter the details in the **Filter Conditions** section.
You can make the alarm more specific by creating monitors on specific tags, providers, or other attributes. To filter the alarms, perform the following steps:
* On the alarm page, click **Add Filter**.
| Field Name | Description |
| ----------- | ------------------------------------------------------------------------------------------------------------------------------------------------------------------------------------------------------------------------------------------------------------------------------------------------------------------------------------------------------------------------------------------------------------------------------------------------------------------------------------- |
| Tag | Specifies the tag to be monitored for anomaly detection. |
| Page Name |
Specifies the Page Name to be monitored for anomaly detection. Select either contains or is from the Operator drop-down menu.
|
| Provider | Specifies the Provider that needs to be monitored for anomaly detection. |
| Device Type | Select this option to display devices such as **Desktop**, **Web**, **Mobile Web**, **Tablet**, and **Other**. |
| OS | Select this option to display information regarding the OS such as **iOS** and **Android**. |
| Language | Select this option to set the preferred language. |
| Domain | Select the appropriate domain name. Select either **contains** or **is** from the **Operator** drop-down menu. |
| Status |
Select this option to set to one of the Tag trigger Statuses. • Success (200) • Success (202) • Provider Side Failure (400) • Provider Side Failure (404) • Provider Side Failure (500) • Tag Validation Failure (900) • Tag Validation Failure (1000) • Error (1001) • Privacy Blocked (1002) • Skipped (1003) • Success with Warnings (1004) • Scheduled for retry (1005) • Maximum retry attempts reached (1006) • Delayed (1007)
|
* Select the Operator options and select any operator to populate the list of available fields.
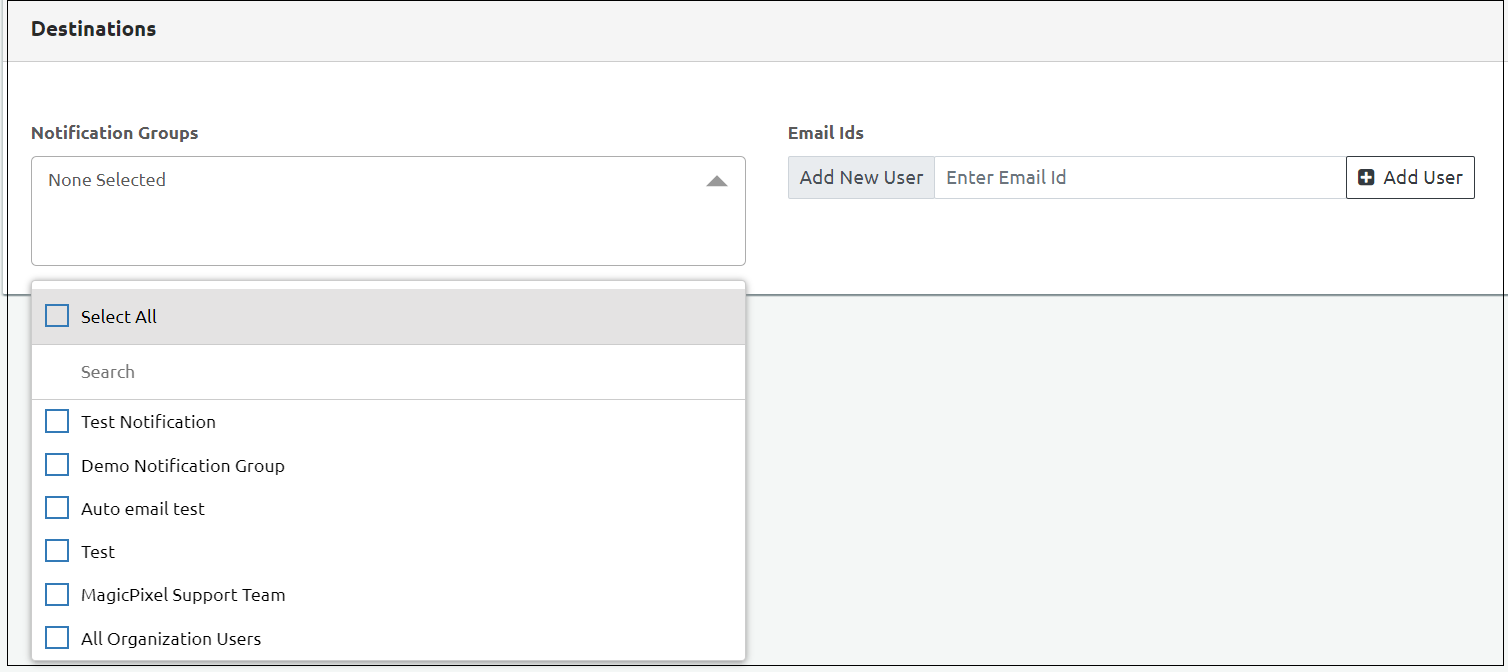
**Step 7:** Select **Destinations** section.
* **Select Notification Group**: The tag anomaly alert will be sent to the contacts configured in the selected notification group. In this step, you can select the check boxes or search for a particular group.
* **Provide Email ID**: Enter the email IDs of the users to send the notification for tag anomaly. You can add users using the **Add Users** tab.
Note: You can select **Notification Groups**, **Email IDs**, or **both**, based on where you want to send the alerts.
**Step 8:** A message appears at the top saying **Alarm added successfully.**
**Step 9:** Click **Save** to save the settings.
---
# Agent Instructions
This documentation is published with GitBook. GitBook is the documentation platform designed so that both humans and AI agents can read, navigate, and reason over technical content effectively. Learn more at gitbook.com.
## Querying This Documentation
If you need additional information that is not directly available in this page, you can query the documentation dynamically by asking a question.
Perform an HTTP GET request on the current page URL with the `ask` query parameter, and the optional `goal` query parameter:
```
GET https://docs.ingestlabs.com/tag-manager/alarms/add-a-new-alarm-tag-anomaly-detection-alarm.md?ask=&goal=
```
`ask` is the immediate question: it should be specific, self-contained, and written in natural language.
`goal` is optional and describes the broader end goal you are ultimately trying to accomplish on behalf of the user. GitBook uses it to tailor the answer towards what is most useful for that goal.
The response will contain a direct answer to the question and relevant excerpts and sources from the documentation.
Use this mechanism when the answer is not explicitly present in the current page, you need clarification or additional context, or you want to retrieve related documentation sections.