Loading...
Loading...
Loading...
Loading...
Loading...
Loading...
Loading...
Loading...
Loading...
Loading...
Loading...
Loading...
Loading...
Loading...
Loading...
Loading...
Loading...
Loading...
Loading...
Loading...
Loading...
Loading...
Loading...
Loading...
Loading...
Loading...
Loading...
Loading...
Loading...
Loading...
Loading...
Loading...
Loading...
Loading...
Loading...
Loading...
Loading...
Loading...
Loading...
Loading...
Loading...
Loading...
Loading...
Loading...
Loading...
Loading...
Loading...
Loading...
Loading...
Loading...
Loading...
Loading...
Loading...
Loading...
Loading...
Loading...
Loading...
Loading...
Loading...
Loading...
Loading...
Loading...
Loading...
Loading...
Loading...
Loading...
Loading...
Loading...
Loading...
Loading...
Loading...
Loading...
Loading...
Loading...
Loading...
Loading...
Loading...
Loading...
Loading...
Loading...
Loading...
Loading...
Loading...
Loading...
Loading...
Loading...
Loading...
Loading...
Loading...
Loading...
Loading...
Loading...
Loading...
Loading...
Loading...
Loading...
Loading...
Reports displays the details similar to the Dashboard in a list format. You can display reports either for the Staging or Production environment.
While tag details are accessible in the Live Debugging and Dashboard sections, Reports offer critical data for debugging. They provide insights into the tags triggered during a session, including their frequency and associated metrics for data analysis. This information is crucial for diagnosing errors at various levels—whether related to the tag itself, the provider, transformation functions, configuration issues, or missing attributes. Using Reports, users can pinpoint specific problems and missing data that may lead to tag failures.
The Reports section includes the following topics:
This document explains the step-by-step procedure to edit a Data Element.
To edit the Data Element, perform the following steps:
Step 1: Select the Data Element you want to edit.
Step 2: From the Actions drop-down menu on the top right corner, select Edit.
Step 3: Edit the Data Element details and click Save on the top-right to save the changes.
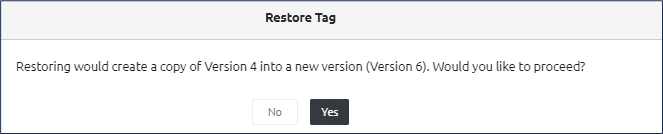
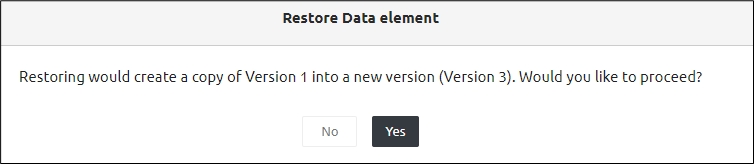
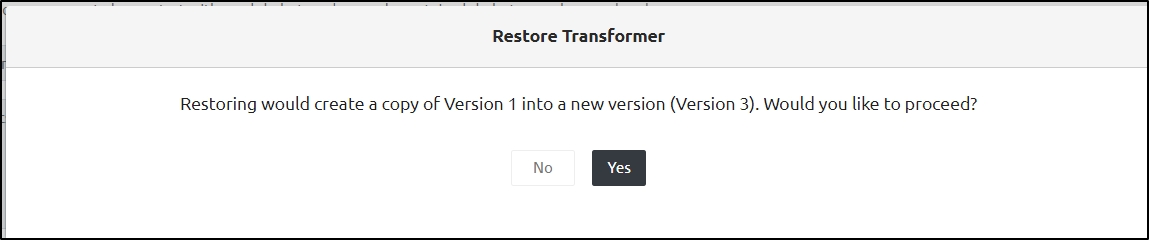
Every tag includes a version number on the top-right corner of the screen. Once the tag is published, the version is set to 1. That is Version 1. After subsequent edits and only after publishing the version number keeps updating to the latest version such as version 2, version 3, and so on.
Note: Until the Tag is published, the status displays as Pending Publish. If the Tag is published in staging, the status is updated as Staging. If the Tag is published in production, the status is updated as Production.
To restore a specific tag version, follow the steps below:
You can delete a particular alarm.
To delete an alarm in Ingest Labs, perform the following steps:
Select the alarm that you want to delete.
From the Actions drop-down menu on the top right corner, select Delete.
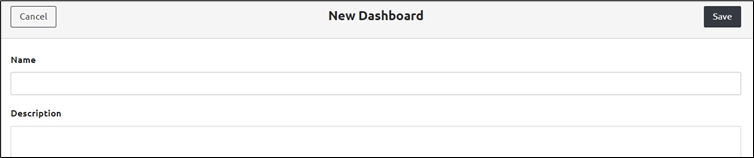
Step Result: The New Dashboard screen appears.
Step 2: Enter the Name and Description in the relevant fields.
Note: Ensure that the number of characters in the name field is five or more. Else the following message appears: Name must be longer than or equal to 5 characters.
Step 3: Click Save to save the changes.
Step Result: The new Dashboard is added successfully.
Note: You cannot edit the Default Dashboard as the project is configured with the default settings.
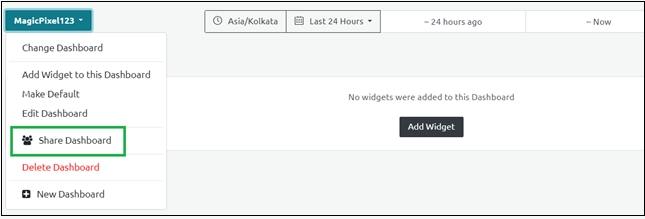
Step 1: Select the Share Dashboard option from the newly created dashboard option.
Step 2: Enter the e-mail ID in the Add New User field and click Add User.
Note: A notification is triggered to the users about the dashboard details.
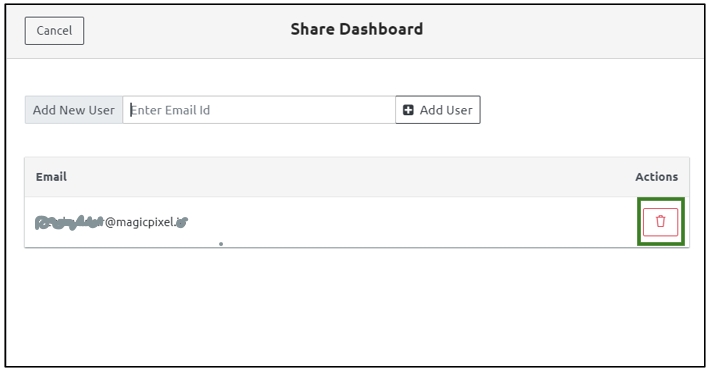
Perform the following steps to stop sharing a Dashboard with a user:
Step 1: Select the Share Dashboard option from the dashboard screen.
Step 2: Click the Delete icon against the user's e-mail ID to delete the user from the shared dashboard.
Step Result: The user details are successfully saved.
Step 2: From the Actions drop-down menu on the top right corner, select Edit.
Step 3: Edit the tag details and click Save on the top-right to save the changes.
Step 1: Click Metadata and click edit
Step 2: Add the Key and the value.
Step 3: Click Add to add more keys and values.
Step 4: Click Save to save the Metadata.
Step 1: From the left navigation panel, click Triggers.
Step 2: At the top-right side of the screen, click the Add Server dropdown menu, then choose for Server.
Step 3: Under the Info section, locate the Name field and enter the appropriate name.
Step 4: Under the Event section, click Add an Event. The Select an Event panel opens on the right side of the screen. You can either use the search bar to find an event or select one from the list.
Step 5: Record Trigger
Under Record Trigger, check the Enable checkbox. The Namespace field will appear—enter the appropriate namespace in this field.
Step 6: Once all the required fields are filled, click Save.
Step 2: From the Actions drop-down menu on the top right corner, select Edit.
Step 3: You can edit the details in the Info, Event, and Record Trigger sections.
Step 4: Click Save on the top right to save the changes.
Navigate to the version you want to restore.
Click the Action dropdown button.
Select Restore to this version from the menu.

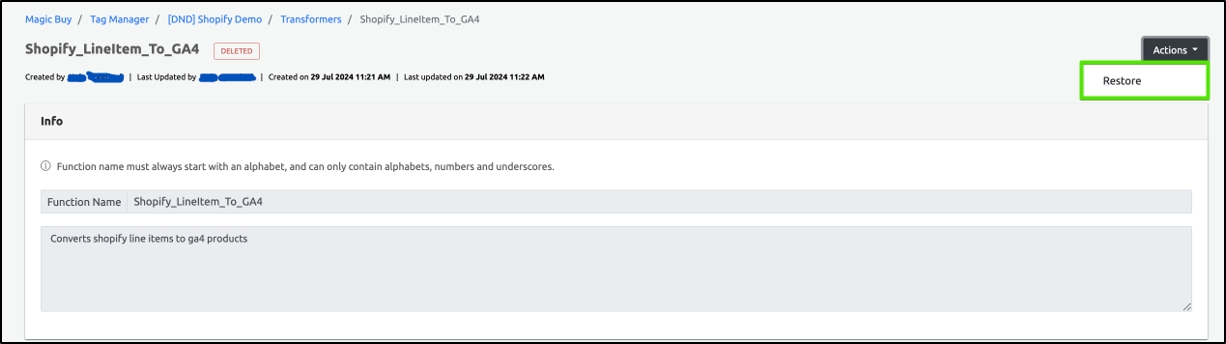
Step 1: Select a deleted tag.
Step 2: Click the Actions button drop-down and select Restore.
Step 3: Click Yes in the Restore confirmatory dialog box that appears.
Step Result: The tag is restored successfully.
Step 2: From the Actions drop-down menu on the top right corner, select Edit.
Step 3: You can edit the details in the Info, Function Arguments, and Code sections.
Step 4: Click Save on the top right to save the changes.
Step 2: From the Actions drop-down menu on the top right corner, select Edit.
Step 3: Update the required fields as needed and click Save on the top-right to save the changes.
When a new Provider is created and published for the first time, it is assigned Version 1. Every time the Provider is edited and then published again, the version number is incremented: Example: Version 2, Version 3, and so on.
Note 1: For the default Providers, the version is always set to “1” because these are populated from the template. Note 2: Until the Provider is published, the status displays Pending Publish. Once the Provider is published in the staging or production environment, the status updates accordingly on the Providers screen.
Step Result: The alarm is deleted successfully.
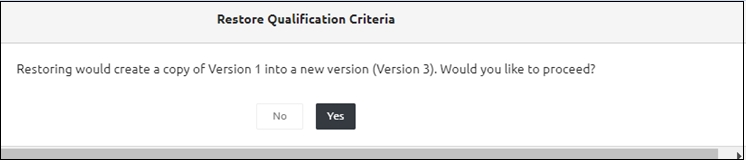
Step 1: Navigate to the Qualification Criteria screen to view the deleted Qualification Criteria.
Step 2: Select the Qualification Criteria you want to restore.
Step 3: Click Restore in the Actions drop-down on the top right corner.
Step 4: Click Yes in the Restore confirmatory dialog box that appears.
Step Result: The Qualification Criteria is restored successfully.
Step 1: Select the Qualification Criteria that you want to edit.
Step 2: From the Actions drop-down menu on the top right corner, select Edit.
Step 3: Edit the required fields, and once done, click Save.


This documentation portal explains how to ingest, manage, orchestrate, and onboard Ingest Labs on to your website.
The Dashboard is the visual representation of data as soon as you log in to the Ingest Labs application. The Dashboard showcases a graph of all the information about tags in a singular view. The Dashboard is available for both Staging and Production environments.
The Dashboard section includes the following topics:
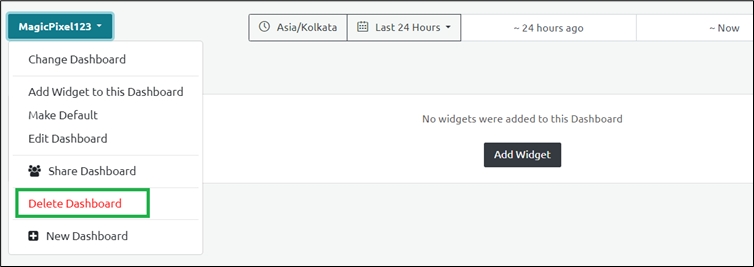
You can delete the newly created dashboard using this option.
To delete the dashboard, perform the following steps:
Step 1: Select Delete Dashboard from the newly created dashboard drop-down menu:
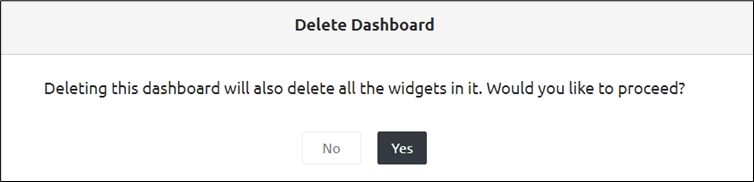
Step 2: A confirmatory dialog box appears with the message: Deleting the dashboard will also delete all widgets in it. Would you like to proceed?
Step 3: Click Yes to confirm the deletion.
Step Result: The Dashboard is deleted successfully along with the added widgets.
A newly created dashboard can be set as the default dashboard.
Follow these steps to set a newly created dashboard as your default dashboard:
Step 1: Select Make Default from the newly created dashboard drop-down menu.
A message pops up confirming, This dashboard has been marked as default.
Step 2: To revert the changes, select Remove as Default.
Note: You must be authorized to perform this action.
Every Qualification Criteria includes a version number on the top-right corner of the screen. Once the Qualification Criteria is published, the Version is set to 1. That is Version 1.
After subsequent edits and only after publishing, the version number keeps updating to the latest version such as Version 2, Version 3, and so on.
When a new Qualification Criteria is created and published for the first time, it is assigned Version 1. Every time the Qualification Criteria is edited and then published again, the version number is incremented: Example: Version 2, Version 3, and so on.
Note 1: For the default Qualification Criteria, the version is always set to “1” because these are populated from the template. Note 2: Until the Qualification Criteria is published, the status displays Pending Publish. Once the Qualification Criteria is published in the staging or production environment, the status updates accordingly on the Qualification Criteria screen.
The Triggers indicate when a particular tag is to be triggered based on the data inputs. The triggers are associated with different actions and events while performing the tasks. Some of the examples for triggers include Product View, View cart, Add to cart, View price, View item, View Payment, and so on. Also, the Qualification Criteria provides the additional criteria to indicate more specific instances of when the tag must be triggered. While the Triggers are mandatory, Qualification Criteria is optional.
The Triggers section includes the following topics:
This document outlines the step-by-step procedure for deleting a particular Data Element.
To delete a Data Element in Ingest Labs, perform the following steps:
Step 1: Select the Data Element you want to delete.
Step 2: From the Actions drop-down menu on the top right corner, select Delete.
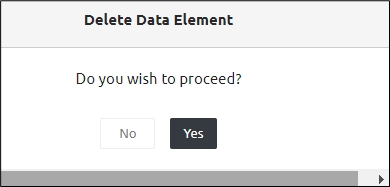
Step 3: Click Yes on the confirmatory message that appears.
Step result: The Data Element is deleted successfully.
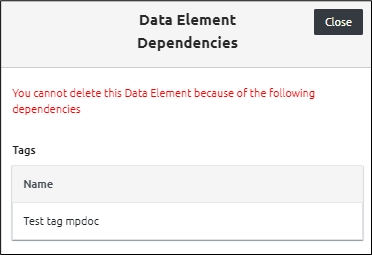
Note 1: You cannot delete a Data Element if there are any dependencies in the tag. Only after deleting the dependent categories, you can delete the Data Element successfully.
Note 2: Even after deleting the dependencies, if you cannot delete the Data Element, then you must Publish the relevant categories first and then perform the delete operation.
Every Data Element includes a version number on the top right corner of the screen. Once the Data Element is published, the Version is set to 1. That is Version 1.
After subsequent edits and only after publishing, the version number keeps on updating to the latest version such as Version 2, version 3, and so on.
When a new Data Element is created and published for the first time, it is assigned Version 1.
Every time the Data Element is edited and then published again, the version number is incremented:
Example: Version 2, Version 3, and so on.
Note 1: For the default Data Elements, the version is always set to “1” because these are populated from the template.
Note 2: Until the Data Element is published, the status displays Pending Publish. When the data element change is published in staging or production environment, the status is updated with the corresponding environment in the Data Elements screen.
This document provides step-by-step instructions on how to restore a deleted Data Element using the Restore option.
To restore a deleted data element, perform the following steps:
Step 1: Navigate to the Data Elements screen to view the deleted Data Element.
Step 2: Select the Data Element you want to delete.
Step 3: In the top right corner, click the Action dropdown, then select Restore.
Step 3: A restore confirmation dialog box appears. Click Yes to proceed.
Step Result: The Data Element is restored successfully.
The Transformers or the transformation functions are the main building blocks of data while implementing tags. The data layer value may return an object and needs to convert it into a variety of other formats to be used within tags or provider attributes.
The standard approach is to create multiple Data elements and format the value each time while creating other Tag Managers. This results in the same data being redefined in various occurrences. However, if the source data changes, then you must update all the instances where it is being read and transformed to different formats.
A transformation function can accept any number of data elements as inputs, format the data, and return it in a different format as required for a dynamic template parameter.
The Transformers section includes the following topics:
Tags are a collection of data elements, providers, qualification criteria, and privacy settings. Tags are used to build simplified data points and analyze and monitor the data in real-time to ease the marketing processes. You can use the code snippet or MediaPixel to configure the data, send data to providers, and simplify the marketing processes. The two types of Tag Management Solutions are Server-side Tagging solution and Browser/Client-side Tagging solution.
In Server-side Tagging, the events are sent to Ingest Labs and based on the events and configuration of tags, the respective tags are triggered. Server-side tagging includes the marketing needs of the server-side ecosystem. You can collect the data in a first-party consented manner for better control over data collection and transfer the high-performance tag management and streaming to the customer. All integrations are performed using MagicPixel UI platform.
In Client-side tagging, events are not sent to the server and all tasks are performed on the client directly. The tags are triggered on the browser or client website and not sent to the server. Ingest Labs collects the tag information and reports triggered through the SDK on the client website. However, the actual tags are triggered on the client.
The Tags section includes the following topics:
You can change the Dashboard and revert to the Default dashboard.
Step 1: From the Default Dashboard dropdown menu, select the Change Dashboard option.
Step 2: Click the Project's Default Dashboard option on the Dashboard screen.
Step Result: The default dashboard appears on the screen.
Step 3: While viewing the Default Dashboard, you can select and navigate to the specific Dashboard to display.
Every Transformer includes a version number on the top-right corner of the screen. Once the Transformer is published, the version is set to 1 — that is Version 1.
After subsequent edits and only after publishing, the version number keeps updating to the latest version, such as Version 2, Version 3, and so on.
When a new Transformer is created and published for the first time, it is assigned Version 1. Every time the Transformer is edited and then published again, the version number is incremented: Example: Version 2, Version 3, and so on.
Note 1: For default Transformers, the version is always set to “1” because these are populated from the template. Note 2: Until the Transformer is published, the status displays Pending Publish. Once the Transformer is published in the staging or production environment, the status updates accordingly on the Transformer screen.
Before publishing a tag in the Production environment, the tag must be published in the Staging environment.
To publish a tag from the Staging to the Production environment, perform the following steps:
Step 1: Select Publish from the left navigation panel.
Step 2: Click the Production tab to view all the tags in the Production environment.
Step 3: Click Publish to Production.
Step Result: The list of Tags, Providers, Transformers, and Triggers appears on the screen.
Step 4: Select the list items that are to be published to production and click Review.
Step 5: In the Name field, enter the name, and in the Description field, enter the description.
Step 6: Click Publish to Production on the top-right of the screen.
Step 7: Click the refresh icon on the top right to change the status from Publish to Staging->Queued->Finished->Published.
Step Result: The relevant tags are published to Production. The tag will be successfully moved from the Staging environment to the Production environment.
This document provides step-by-step instructions for deleting a Qualification Criteria.
Step 1: Select the Qualification Criteria that you want to delete.
Step 2: From the Actions drop-down menu on the top right corner, select Delete.
Step 3: Click Yes on the confirmatory message that appears.
Step Result: The Qualification Criteria is deleted successfully.
Note: You cannot delete a Qualification Criteria if there are any dependencies in the tag. Only after deleting the dependent categories, you can delete the Qualification Criteria successfully. Even after deleting the dependencies, if you cannot delete the Qualification Criteria, then you must Publish the relevant categories first and then perform the delete operation.
Data Elements are the core components you define while creating the tags. Data elements act as components that intelligently fetch information from across your digital property. You can create any number of custom Data elements for a particular Data type and define the elements in the tags as per client requirements. Some of the Data types include Server Header, Server Cookie, Magic Pixel Data Layer, URL Parameter, Custom JavaScript, Custom event, and so on.
The Data Elements section includes the following topics:
This document explains step by step how to add Triggers to the browser side. All the information required for Client-side or Browser-side configuratin.
on is fetched from the webpage or browser.
To add a new Trigger, perform the following steps:
Step 1: From the left navigation panel, select Triggers.
Step 2: On the top-right corner of the screen, click the Add Trigger dropdown, then select For Browser.
Step 3: Under the Info section, locate the Name field and enter the appropriate name.
Step 4: Under the Event section, click on Data Element. The Select Data Element panel opens on the right side of the screen. You can use the search bar to find a specific Data Element or browse through the list.
Step 5: Record Trigger
Under the Record Trigger section, select the Enable checkbox. Once enabled, the Namespace field appears. Enter the appropriate namespace in the Namespace field.
Step 6: Once all the required fields are filled, click Save to apply the changes.
This section explains how to edit the status of a provider under the Data Governance module.
To edit the status of the provider under Data Governance, perform the following steps:
Step 1: From the left navigation panel, click the Data Governance drop-down, and then click Provider.
Step 2: Click Edit to modify the provider’s details.
Step 3: From the Status column, open the Allowed drop-down menu and select Blocked to stop data tracking. You can also change the status back to Allowed if you want to enable data tracking again.
Step 4: Click Review to review the changes before you submit the changes.
Step 5: Enter the name in the Name field and a description in the Description field, then click Save. Click Submit to submit the changes.
Step 6: A confirmation message will appear indicating that the provider’s data has been updated successfully.
Step Result: The Provider status is updated in the Data Governance screen as well as in the section.
Alarms are the notifications triggered by specific events or conditions within the Tag Manager of Ingest Labs. Alarm notifications can be set to alert users when a tag expires, or is about to expire, or when there is a sudden anomaly in the tag behavior.
The two types of Alarms are Tag Anomaly Detection Alarm and the Tag Expiration Alarm.
The tags are typically triggered consistently over time. This regular pattern is monitored using the Bollinger band. However, there could be an anomaly or an abnormal tag behavior with a sudden spike or drop in the tag trigger. You can configure alarms to detect such anomalies in the tag behavior and receive timely notifications.
When configuring a tag within the Tag Manager, you can specify start and end dates for execution. Alarms can be set to notify configured contacts on tag expiry or just before tags expire. By default, if you do not select any criteria or filters while creating a new alarm, the alarm will be triggered for all configured tags within the project.
Additionally, using the Tag Expiry Look Back feature, you can set alarms in advance, specifying the number of days before tag expiration for reminder notifications and the exact time for alarm triggering.
The Alarms section includes the following topics:
The Providers are the key components to be defined before you create tags. Providers include Media providers for implementing the server-side and client-side tags. You can select from the provider templates created and listed by Ingest Labs or add a custom provider template.
The Providers section includes the following topics:
A deleted transformer can be restored using the Restore option.
To restore a deleted transformer, perform the following steps:
Step 1: Navigate to the Transformers screen to view the deleted transformer.
Step 2: Select the Transformer and click Restore in the Actions drop-down on the top right corner.
Step 3: Click Yes in the Restore confirmatory dialog box that appears.
Step Result: The Transformer is restored successfully.
Once the Provider status is updated, you can view all the client-side changes. The Data Governance Timeline screen lists all the providers updated from Allowed to Blocked or Blocked to Allowed.
Note: Whenever a provider status is modified from Allowed to Blocked or Blocked to Allowed under Data Governance, the Provider section is also modified with the changes.
You must also ensure to navigate to the Publish section and publish the provider status of the respective provider.
Click the show changes to view the timeline changes:
You can add a tag using any of the following options:
Browser: For the conventional method of tagging using the browser.
Server: For backward compatibility and support to create new tags on the server.
In Ingest Labs, you can create media tags for client-side and server-side seamlessly and quickly using the following steps. For browser-side tagging creation, the conventional method of tagging is applicable.
The following elements are mandatory to add a new tag:
Data Governance ensures companies follow legal regulations when triggering tags in Tag Manager. Data Governance serves as a controller or approver for these guidelines, which may include government policies like CCPA and GDPR. For example, when a website detects a visitor from a state with privacy laws, it displays a consent banner. This banner informs the user that their information will be tracked after obtaining their consent for further data tracking purposes.
The banner providers are called Consent Managers, with One Trust being a prominent example. Ingest Labs utilizes the consent obtained from these banners to determine whether to trigger media tags. The Privacy Compliance Data element, pr_comp, returns True or False when Ingest Labs executes the provided JavaScript in the Custom JavaScript section. With Ingest Labs, you can seamlessly integrate with any Consent Manager available, as long as it can read consent from the website browser using JavaScript.
The default pr_comp value is set to true. This means that a user’s activities are tracked by default.
Even if a user denies data tracking consent, Ingest Labs has some providers in the ‘allowed’ state, that will still always be allowed. The other providers, however, in the ‘blocked’ state are blocked when a user denies consent.
A client can choose to block or allow providers at any time. Ingest Labs marks such changed providers as 'modified' until the client publishes them manually. After publishing, the provider is successfully modified.
The Qualification Criteria are similar to Triggers that are performed to trigger the tag for a specific condition. The Ingest Labs triggers the tag when the Qualification Criteria is met for either browser-side tags or server-side tags.
Note: The Qualification Criteria evaluates the conditions to trigger a tag. For a particular tag to trigger, the qualification criteria is optional. However, when the Qualification Criteria is provided along with the Triggers, then the conditions for Triggers and Qualification Criteria must return true. Only then the tag gets triggered.
Also, if the Qualification Criteria is not defined, the tag is triggered only when the triggers are invoked.
The Data Governance section includes the following topics:
Data Governance Screen


Please rate this document to help us improve the content


Navigate to the left navigation panel.
Click on Reports to open the Report screen.
Understanding Report Columns
Tag Column: Displays the Tag name.
Tag Fires Column: Shows the number of times the tag is triggered.
Adding a Filter
Click Add Filter.
Select the filter criteria as needed.
Default Time Range
Reports are generated for a 24-hour period by default.
Filtering Reports by Time Range
To view reports for a specific time range:
Click the dropdown under Custom Range.
Choose one of the available time ranges:
Today so far
Last 3 hours
Last 6 hours
Last 24 hours
Last 7 days
Last month
The report will be displayed based on the selected time range.
Manually Selecting a Time Range
You can manually select a start date and end date to filter the report data according to your requirements.
Note: You can also manually enter the date and time.
Refreshing the Report
Each time you modify the time range selection, click the Refresh button to update the report accordingly.
Selecting the Environment
Click the Environment dropdown and choose one of the following:
Production: Redirects to the Production environment.
Staging: Redirects to the Staging environment.
Adjusting Items Displayed per Page
Click the dropdown to select the number of items displayed per page.
The available options are:
20 items per page
50 items per page
100 items per page
Note: Ingest Labs retains the metadata information for a period of 6 months at any given point. For customers who have Enterprise contracts with longer data retention needs, Ingest Labs retains and archives the data as agreed in contracts.

The Provider acts as a template to define the attributes on a high-level, before configuring the tag. You can select any of the available provider templates, set the attributes, save the provider template, and configure the tag. Note: If the default provider templates are unavailable, you can create a custom-defined template using the Providers option on the left navigation panel.
The Data elements refer to the data points that are sent to the Provider to populate the values while configuring the tag.
The Triggers indicate when a particular tag is to be triggered based on the data inputs. The triggers are associated with different actions and events while performing the tasks under tags.
The Qualification criteria refer to the rules and conditions required to trigger a tag for a particular scenario. You must set the rules when the tags are to be triggered for different scenarios and send the data to the data endpoints.
Step 2: In the top right corner, click the Actions drop-down and select Delete.
Step 3: Click Yes on the confirmatory message that appears.
Step Result: The Transformer is deleted successfully.
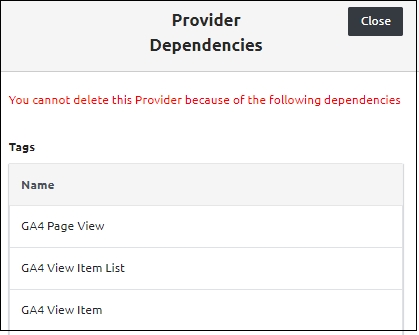
Note: The following error occurs if there are any dependencies for the transformers in tags.
Step 2: Click the Add Qualification Criteria drop-down and select For Browser.
Step 3: Under Info, enter the Qualification Criteria name in the Name field.
Step 4: Under Data Elements, click Add Data Element.
The Select Data Element panel opens on the right side. You can choose a data element from the User Defined or Default tabs, or use the search bar to find a specific data element.
Step 5: Under the Include these values section, click Add Value and enter the value you want to include. Then, click the plus symbol.
Step 5.1:
Case Sensitive: This option indicates if the value entered is Case sensitive to further trigger the tag.
Exact Match: This option indicates if the value matches exactly to trigger the tag.
Step 6: Under Exclude these values, type the value you want to remove, then click the plus icon to exclude it.
Step 6.1:
• Case Sensitive: This option indicates if the value entered is Case sensitive to further trigger the tag. • Exact Match: This option indicates if the value exactly matches to trigger the tag.
Step 6: Click Save on the top right to save the Qualification Criteria details.+
Step 1: Select Publish from the left navigation panel.
Step 2: Click the staging tab.
Step 3: Click Publish to Staging.
Step Result: The Publish to Staging screen appears. Any newly created elements remain in a pending publish status, and you can view them here on this screen.
Step 4: Select the element and click Review on the top-right corner of the screen.
Step 5: Enter the Publishing Name in the Name field and provide Description.
Step 6: Review the tags that are selected and click Publish to Staging.
Step 7: Click the refresh icon on the top right to change the status from Publish to Staging->Queued->Finished->Published.
Step Result: The Published tag appears with the Published status.
Step 2: Right-click on the webpage, select Inspect, and then click the Console tab.
Step 3: Enter the following command: _mp.printDebugId()
Step Result: The Debug ID appears on the screen.
Step 1: Navigate to the Triggers screen to view the deleted trigger.
Step 2: Select the deleted Trigger, and click Restore under the Actions drop-down on the top-right corner.
Step 3: Click Yes in the Restore Trigger confirmatory dialog box that appears.
Step Result: The Trigger is restored successfully.
Name
Name of the project.
Description
Description of the project.
Project Type
Denotes the project type.
Project Framework
Shows the framework used for the project.
Demand-Side Platform (DSP)
By default, this option is disabled. To enable the DSP in this project, reach out to the Support team.
Step 2: Click edit on the top right corner to edit the project name and the description.
Step 3: Click Save to save the changes. Click cancel to revert to the original settings.
Step 1: To delete a project, click the Actions dropdown at the top, and then select Delete Project.
Step 2: Click OK in the confirmatory dialog box that appears.
Step Result: The project is deleted.
Note: A disabled tag can be identified by its faded or lighter color. When you hover over it, a tooltip appears indicating that the tag is disabled.
Step 2: Go to Tag Status, click the dropdown, and select Disabled from the list.
It will display a list of disabled tags. Select the tag you want to enable.
Step 3: From the Actions drop-down menu on the top right corner, select Enable.
Step Result: The tag is enabled successfully.
Step 1: Click Add Filter.
The Add Filter panel opens on the right side.
Step 2: Click the Select a Field drop-down and select the appropriate field.
Step 3: Click the Select an Operator drop-down and choose the appropriate operator.
You will see two options:
Is one of – use this when you want to include only the selected values.
Is not one of – use this when you want to exclude the selected values.
After selecting the operator, a list opens. Select one or multiple values from the list as per your requirement.
Step 4: Click Add Filter to apply the filter.

Step 2: There are two environments present:
Production – When elements are pushed to the production environment, you can check the live details in the production environment.
Staging – When elements are pushed to the staging environment, you can check the live details in the staging environment.
For this demonstration we have taken example of Production, click Production.
Step 3: Click Start Debugging on the top right corner of the screen.
Step 4: Enter the Debug ID in the Debug ID field or click Start to start the debugging session. You need to enter a Debug ID to see events exclusively from your session on the website.
The following screen appears:
Step Result: The live debugging details appear on the screen. Now, you can view all the events firing in real time, only for your session on the website, for debugging purposes.
Note 1: The Debug ID is unique and is meant to streamline traffic tracking. Without a debug ID, you will be bombarded with general traffic data. Using a debug ID will help to streamline data and view the traffic for a particular session. A debug ID is not mandatory for Staging. A Debug ID is required for Production due to the huge network traffic.
Note 2: To retrieve the Debug ID, follow the procedure Retrieve the DebugID Using Console.
Step 2: Edit the details in the Update Dashboard.
Step 3: Click Save.
Step Result: The dashboard details are updated.
When a new Trigger is created and published for the first time, it is assigned Version 1. Every time the Trigger is edited and then published again, the version number is incremented: Example: Version 2, Version 3, and so on.
Note 1: For default Triggers, the version is always set to 1 because these are populated from the template. Note 2: Until the Trigger is published, the status displays Pending Publish. Once the Trigger is published in the staging or production environment, the status updates accordingly on the Triggers screen.
Name
The Name field shows which Environment it is, such as Staging or Production.
Status
Denotes the Environment status.
Author
Denotes the user who created the environment.
Last Updated on
Denotes when the Environment is last updated.


Please rate this document to help us improve the content

Please rate this document to help us improve the content


Please rate this document to help us improve the content


Please rate this document to help us improve the content


Add a New Project is the first step in the entire Tag Management process soon after you launch the Ingest Labs application.
To add a new Project, perform the following steps:
Step 1: On the dashboard, in the Easily access your products section, locate Tag Manager, and then click Launch.
Step 2: On the Project screen, in the top-right corner, click Add Project.
Step 3: On the New Project screen, in the Name field, enter an appropriate name.
Step 4: In the Description field, enter a relevant description.
Note: The Name and Description fields are mandatory. If not provided, an error message This value is required. appears below the respective fields.
Step 5: Under Project Type, select an option based on your project:
Website: Select this option if the project is website-based.
Mobile App: Select this option if the project is a mobile application.
Step 6: If you select Website, the Demand-Side Platform (DSP) section appears.
Note: By default, Website is selected.
Step 6.1: Check the Enable DSP integration checkbox.
DSP Integration: DSP integration is the process of connecting a Demand-Side Platform (DSP) with other systems to deliver targeted ads efficiently by using customer data, campaign insights, and inventory sources.
Step 6.2: In the Select Provider drop-down, select the appropriate provider.
Note: DSP integration is enabled only if required by the client.
Step 7: If you select Mobile App, the Select Mobile App Platform section appears.
Step 7.1: In the Select Mobile App Platform drop-down, select the appropriate platform:
Native – Select this option if the app is developed using native programming languages such as Swift (for iOS) or Kotlin/Java (for Android).
React Native – Select this option if the app is built using React Native, a cross-platform framework that allows you to develop apps for both iOS and Android using JavaScript and React.
Ionic – Select this option if the app is built using Ionic, a framework that enables the development of hybrid mobile applications using web technologies like HTML, CSS, and JavaScript.
Step 8: Click Create Project.
Result: This creates the project successfully and adds it to the project list.
This document explains step by step how to add Qualification Criteria to the server side. All the information required for Client-side or Server-side configuration is provided.
Step 1: From the left navigation panel, select Qualification Criteria.
Step 2: Click the Add Qualification Criteria dropdown and select For Server.
Step 3: Under Info, enter the Qualification Criteria Name in the Name field.
Step 4: Under Data Element, click Add Data Element.
The Select Data Element panel opens on the right side. Choose from the User Defined or Default tabs or use the search bar to find a Data Element.
Step 5: Under the Include these values section, click Add Value and enter the value you want to include. Then, click the plus symbol.
Step 5.1:
Case Sensitive: This option indicates if the value entered is Case sensitive to further trigger the tag.
Exact Match: This option indicates if the value matches exactly to trigger the tag.
Step 6: Under Exclude these values, type the value you want to remove, then click the plus icon to exclude it.
Step 6.1:
• Case Sensitive: This option indicates if the value entered is Case sensitive to further trigger the tag. • Exact Match: This option indicates if the value exactly matches to trigger the tag.
Step 7: Click Save on the top right to save the Qualification Criteria details.
A Consent Provider collects, stores, and manages users’ permission for data collection and use.
Step 1: Under the Data Governance drop-down, click Consent Providers.
Step 2: Click on Add Consent Provider.
Step 3: The Consent Provider panel opens from the right side. In the Name field, enter the appropriate name. In the Description field, provide a proper description.
Step 4: Click Consent Template. The Select Consent Template panel opens. Choose a template from the drop-down list or use the search bar to find and select the required template.
Step 5: The selected Consent Template is displayed under the Consent Template field. Click Save.
Step 6: The created Consent Provider is displayed on the screen with the following details:
Name – The name of the Consent Provider.
Template – The Consent Template associated with the provider.
Status – Indicates the current state of the provider.
Updated By – The user who last updated the provider.
The Publish option provides an overview of all the tags that are present on the Ingest Labs application. Any tag that is created in Ingest Labs includes the following stages:
Pending Publish: A newly created tag appears with a "Pending Publish" status in orange color.
Staging: Before any tag can be published to "Production" it has to be first published to "Staging". Once published to staging, it displays as staging in green.
Production: In the Publish Project to Production screen, review the tags, providers, triggers, and transformers that are ready for production. You can now publish the tag to "Production". Once you publish the tag in production, it displays production in green.
The stages are displayed on the Tags UI screen:
Note: A disabled tag is displayed in grey background.
The Publish section includes the following topics:
The Dashboard screen includes the following details:

Updated On – The date and time of the last update.


Data Elements (6 of 6) This section shows the number of Data Elements currently displayed out of the total available.
You can adjust how many Data Elements are shown per page using the dropdown menu at the top-right corner of the screen:
50 per page – Displays up to 50 Data Elements on the current page.
100 per page – Displays up to 100 Data Elements on the current page.
200 per page – Displays up to 200 Data Elements on the current page.
You can filter the Data Elements based on the following types:
Filter by Name: Use this filter to narrow down Data Elements based on their names.
Filter by Attribute Value: Use this filter to narrow down Data Elements based on their attribute values.
Filter by Metadata Attribute: Use this filter to narrow down Data Elements based on their metadata attributes.
The following are the additional fields that appear on the Data Elements screen.
Name
Denotes the Data Element Name.
Support
Denotes whether the tag is a server-side or a browser-side setting. • C: Denotes that the Data Element is client-side. • S: Denotes that the Data Element is server-side.
Status
Denotes the status of the Data Element: • Production: The Data Element is in the production stage. • Staging: The Data Element is in the Staging process. • Pending Publish: The Data Element is yet to be Published. • Published: The Data Element is in the Published stage. • Deleted: The Data Element is deleted.
Type
Denotes the type of the Data Element. For example, URL Parameter, Custom Java script, and so on.
Created By
Denotes the user who created the Data Element.
Updated By
Denotes the user who updated the Data Element.
The Refresh button allows you to reload the DATA elements screen. If you create new DATA elements or update their properties and the changes are not immediately visible on the main UI screen, clicking the Refresh button will reload the page to display the most up-to-date information.
Default DATA Elements Checkbox
Select the Default Data Elements check box at the top to list the readily available default data elements. The specific default template will be used for the particular data elements.
Clearing the checkbox shows all available DATA elements.

Navigate to the Reports screen.
Click Add Filter.
Step 2: Select Field Type
From the Select a Field drop-down menu, choose a field type based on your reporting needs.
Tag
Specifies the tag that needs to be filtered.
Page Name
Specifies the Page Name. Select either contains or is from the Operator drop-down menu.
Provider
Specifies the Provider that needs to be filtered.
Device Type
Select this option to display the device type such as Desktop Web, Mobile Web, Tablet, and Other.
Browser
Select this option to display information regarding the Browser types such as Chrome, Safari, Edge, IE, Firefox, Opera, and Other.
Language
Select this option to set the preferred language.
Step 3: Choose an Operator
From the Operator drop-down menu, select a suitable operator:
Is one of - This operator allows you to filter reports that match any of the selected values.
Is not one of - This operator excludes the selected values from the results.
Step 4: Select applicable field types
Select all the applicable field types from the drop-down.
The selected fields are displayed here for confirmation.
Step 5: Apply the Filter
Click Add Filter to apply the selected criteria.
Note: To remove the filter, click the small cancel icon next to the filter category.
Step Result
The Reports for the respective field types appear.
Step 6: Modify Column Settings
To customize the visible columns:
Click the Settings icon on the top-right corner.
Select the required columns to display.
Click Submit to apply the column settings.
Final Result: The Reports with the selected columns appear on the screen.
Privacy Blocked Tags
Tags that are blocked due to privacy consent from the users.
Tag Errors
Indicates the unknown tag errors.
Success with Validation Failures
The number of tags that are successfully triggered but have missing values.
Tag Distribution - Browsers
The number of successful tags across different browsers.
Tag Distribution - Devices
The number of tags across different devices.
Tag Contribution - Browsers
The browser composition of tags across the website.
Tag Contribution - Devices
The device composition of tags across the website.
By default, the Dashboard is set to an hourly session and displays the Default Dashboard. To apply the selected time range and update the dashboard data, click the Refresh button.
Custom Time Range
In the Custom Range section, you can select from the following predefined options in the dropdown menu:
Today so far – Displays data from the start of the current day up to the present time.
Last 3 hours – Shows data for the most recent 3-hour window.
Last 6 hours – Displays data collected over the past 6 hours.
Last 24 hours – Provides data for the past 24-hour period.
Last 7 days – Retrieves data from the past 7 days, including the current day.
Last 1 month – Displays data for the previous month from the current date.
Additionally, you can manually define a start date and end date to filter the dashboard data based on your requirements.
Note: Ingest Labs retains the Dashboard data for a maximum period of 24 months. After 24 months, the data is deleted. To view the Dashboard for a specific custom range, select the time range from the ~ 24 hours ago option and click Refresh.
Click the Refresh button to update the dashboard with the latest data.
Click the dropdown to switch the Dashboard display between the Staging and Production environments.
Total Tag Fires
The total number of tags triggered during a particular duration.
Successful Tag Fires
The number of tags that the Media Provider successfully receives.
Provider Side Tag Failures
The tags that failed validation at the Media Provider.
Tag Validation Failures

The tags that failed mandatory attributes validation.
Using the Filter Triggers option, you can filter the triggers based on the following types:
Filter By Name: Filters the trigger based on the trigger name.
Filter By Attribute Value: Filters the trigger based on Attribute Value.
Filter By Metadata Attribute: Filters the trigger based on Metadata Attribute.
To create a new Trigger, click on the Add Trigger option located at the top-right corner of the screen.
Triggers (21 of 21)
This section shows the number of Triggers currently displayed out of the total available.
This option indicates the number of Triggers currently displayed out of the total available Triggers. You can adjust the number of Triggers displayed per page using the dropdown menu located at the top-right corner of the screen.
50 per page: Displays up to 50 Triggers on the current page.
100 per page: Displays up to 100 Triggers on the current page.
200 per page: Displays up to 200 Triggers on the current page.
The Filter By Data Elements option allows to filter the triggers based on the Data Elements.
You can select either the User-defined Data Element or Default Data Element in the Choose Data Elements screen.
The Refresh button allows you to reload the Triggers screen. If you create new Triggers or update their properties and the changes are not immediately visible on the main UI screen, clicking the Refresh button will reload the page to display the most up-to-date information.
Select the Default Triggers check box if you are selecting the default triggers for a particular tag.
Red color indicates that the trigger is actively being recorded.
The following are the additional fields that appear on the Triggers screen.
Name
Denotes the trigger Name.
Support
Denotes whether the trigger is a server-side or a browser-side setting.
C: Denotes that the Trigger is client-side.
S: Denotes that the Trigger is server-side.
Status
Denotes the status of the Trigger. • Production: The Trigger is in Production status. • Staging: The Trigger is in Staging status. • Pending Publish: The Trigger is yet to be published.
Created By
Denotes the user who created the Trigger.
Updated By
Denotes the user who updated the Trigger.
Updated On
Denotes when the Trigger is last updated.
Click Add Tag.
The Select Provider panel will open on the right side of the screen.
Use the search bar at the top of the panel to find a specific provider, or
Browse through the list of available providers and select the one you need.
Step 1: In the navigation panel, click Transformers.
Step 2: Click the Add Transformer drop-down and select For Server.
Step 3: Under the Info section, in the Function Name field, enter the appropriate name.
Note: The Function name must always start with an alphabet, and can only contain letters, numbers and underscores.
Step 4: In the Description field, enter an appropriate description.
Step 5: Under the Function Arguments field, click Add Arguments.
Step 5.1: In the Name field, enter the appropriate name.
Step 5.2: Under the Value field, click Select Data Element.
The Select Data Element panel opens on the right side.
Two tabs are available:
User-defined
Default
You can select a data element from these tabs or use the search bar.
Note: Click the selected argument data element value. The data element details will appear in the right panel.
Note: To clear the selected data element value, click the small X icon next to it.
Step 5.3: The following checkboxes are available:
Mandatory: Select this checkbox to make the argument required.
URL Encode: Select this checkbox to encode the value for safe URL transmission.
Hash (SHA256): Select this checkbox to hash the value using the SHA256 algorithm.
Note: To delete the Argument, click the Delete icon on the right-hand corner of the screen.
Step 6: To access the Argument, enter the code in the Code section. You can also test the function using the Test Function tab on the right-hand corner of the screen.
Step 7: Click the Full Screen icon to expand the code and view it in full screen mode.
Step 8: Click Test Function. The Test Function panel opens.
Step 9: Click the Select dropdown and choose an input type:
Number — Use this option if your function requires a numeric input.
String — Use this option if your function requires text input.
Boolean — Use this option if your function requires a true/false value.
JSON — Use this option if your function requires structured data in JSON format.
Step 10: Enter the Argument value that corresponds to the selected input type.
Step 11: Navigate to the Output tab to view the result of the executed function.
Step 12: Click Save to save the Transformer details.
The Info section includes the following information.
Name: Displays production, indicating the environment type.
Description: Displays Production Environment, which gives more details about the selected environment.
Click Edit.
The SDK Settings section includes the following information:
Denotes the specific event that will be used to trigger the tag.
Specifies the condition that activates the tag. You can choose from the following options:
On Page Interactive – Triggers the tag when the page becomes interactive (for example, when the DOM is fully parsed and ready for user interaction).
On Page Loaded – Triggers the tag as soon as the page is loaded.
Custom Page Event – Allows you to define a custom event that triggers the tag.
Select this checkbox to enable a secondary trigger.
Once enabled, two additional fields appear:
Variable Name – Specify the JavaScript variable that acts as the secondary trigger.
Wait Time – Enter the in milliseconds that the system should wait before triggering the secondary action.
Determines how the cookie domain is set. Two options are available:
Auto – The cookie domain is automatically detected at runtime.
Manual – Allows you to manually specify the cookie domain.
Note: The cookie domain is automatically detected at runtime, so you don’t need to configure it manually.
Provides options to capture and report SDK errors on the client side.
Report Client-side SDK Errors – Select this checkbox to allow the Client SDK to report errors and exceptions to the Ingest Labs servers.
Enable Logging for Client-side SDK – Select this checkbox to capture and log client-side SDK activities locally for troubleshooting.
With Trigger Delay, you can set how long, in milliseconds, the system should wait after the page loads before firing the tag.
Note: Allows the page to render its content before the Tag Manager is fired, ensuring that all necessary elements are available.
This allows the client to add an additional CSP field so we can use the same csp field to add scripts to the website - Else, it will fail. Select this check box to enable or disable this option. If Enabled, the following option is available.
Meta tag attribute name for Nonce: The Attribute name in meta tag where the Nonce value is configured in the website.
To set up Ingest Labs SDK, you must include the following script tag in index.html file of the website. Once the script is executed, the SDK is installed on the client website.
The following is the SDK URL that you must embed in the Production environment of the client website. In the IDL Setup, the idl.js file is Identity Link or First party identity script file. The following is the IDL setup url that you must embed in the Production environment of the client website:
The Approved Domains has the list of domains on which the SDK will run. The SDK will execute only these listed domains. This is to avoid spamming and to ensure that the SDK of one site is not used on another site.
The Script sdk url changes when the domain is verified based on the data collector configuration. This decides which collector url to pick based on what domain. Collector url is the url to which Server Side Tags and report calls are sent.
The Approved Domains & Collector URLs display the following information:
Domain – Enter your website domain in this field.
Collector URL – This displays the URL where the collected data is sent.
Approved Data Collection Domains – This section lists the domains that are authorized to collect data.
Step 1: From the left navigation panel, select Transformers.
Step 2: Click the Add Transformer drop-down and select For Browser.
Step 3: Under the Info section, enter the function name in the Function Name field.
Step 4: Enter the Description in the Description field.
Step 5: In the Function Arguments section, click Add Agreement.
Step 5.1: In the Name field, enter the appropriate name.
Step 5.2: Under Value, click Select Data Element.
Step 5.3: The Select Data Element panel opens on the right side. Two tabs are available — User-defined and Default. You can select a data element from these tabs or use the search bar to find one.
Note: Click the selected argument data element value. The data element details will appear in the right panel.
Note: To clear the selected data element value, click the small X icon next to it.
Step 5.4: Select the checkboxes for Mandatory and URL Encode, if required.
Note: To delete the Argument, click the Delete icon on the right-hand corner of the screen.
Step 6: To access the Argument, enter the code in the Code section. You can also Test the function using the Test Function tab on the right-hand corner of the screen.
Step 7: Click the Full Screen icon to expand the code and view it in full screen mode.
Step 8: Click Test Function. The Test Function panel opens.
Step 9: Click the Select dropdown and choose an input type:
Number — Use this option if your function requires a numeric input.
String — Use this option if your function requires text input.
Boolean — Use this option if your function requires a true/false value.
JSON — Use this option if your function requires structured data in JSON format.
Step 10: Enter the Argument value that corresponds to the selected input type.
Step 11: Navigate to the Output tab to view the result of the executed function.
Step 12: Click Save to save the Transformers details.
Step 1: Select Alarms from the left navigation panel.
Step 2: Click Add Alarm on the top-right corner of the screen.
Step 3: Select the Tag Anomaly Detection Alarm.
Step 4: In the Name field, enter the alarm name, and in the Description field, enter a brief description of the alarm.
Step 5: Under Environment, click the Select Environment dropdown. Two options are available — Production and Staging. Click the appropriate option.
Step 6: Enter the details mentioned in the Settings section.
Threshold Sensitivity:
High sensitivity: The anomaly detection trigger will fire and send alert if it detects an anomaly at least ONCE in the previous hour.
Medium sensitivity: The anomaly detection trigger will fire and send alert if it detects an anomaly once in the past 2 consecutive hours.
Low sensitivity: The anomaly detection trigger will fire and send alert if it detects an anomaly once in the past 3 consecutive hours.
The Tag behavior is determined using the Bollinger Band.
Preferred Timings:
Select the exact tag monitoring period from the Preferred Timings drop-down. This is an optional setting. For example, If there is a sudden spike in traffic in the evenings, you could set the preferred timing from 5 p.m. to 10 p.m. The tag firing activities will be monitored every evening between 5 p.m. to 10 p.m.
Note: The tags are monitored continuously with a set preferred timing.
Step 6: Enter the details in the Filter Conditions section.
You can make the alarm more specific by creating monitors on specific tags, providers, or other attributes. To filter the alarms, perform the following steps:
On the alarm page, click Add Filter.
Tag
Specifies the tag to be monitored for anomaly detection.
Page Name
Specifies the Page Name to be monitored for anomaly detection. Select either contains or is from the Operator drop-down menu.
Provider
Specifies the Provider that needs to be monitored for anomaly detection.
Device Type
Select this option to display devices such as Desktop, Web, Mobile Web, Tablet, and Other.
OS
Select this option to display information regarding the OS such as iOS and Android.
Language
Select this option to set the preferred language.
Select the Operator options and select any operator to populate the list of available fields.
Step 7: Select Destinations section.
Select Notification Group: The tag anomaly alert will be sent to the contacts configured in the selected notification group. In this step, you can select the check boxes or search for a particular group.
Provide Email ID: Enter the email IDs of the users to send the notification for tag anomaly. You can add users using the Add Users tab.
Note: You can select Notification Groups, Email IDs, or both, based on where you want to send the alerts.
Step 8: A message appears at the top saying Alarm added successfully.
Step 9: Click Save to save the settings.
Navigate to Tag Manager > Alarms.
Step 1: Click the Add Alarm dropdown and select Add Funnel Monitoring Alarm.
Step 2: Under the Info section, the Name and Description fields are available. In the Name field, enter a descriptive name for your Funnel Monitoring Alarm, and in the Description field, provide additional details to clarify the purpose or scope of the alarm.
Step 3: Under Funnel Monitoring Type, in the Select Funnel Monitoring Type dropdown, two options are available:
· Conversion and
· Occurrence
Step 3.1: Click Conversion.
Conversion: This option tracks the percentage of users who progress from adding products to their cart to completing a purchase. For example, if a user visits the website, adds products to the cart but does not complete the purchase, the website owner can use this alarm to monitor the conversion rate. The alarm provides a clear percentage, helping the owner understand how many users are converting from Add to Cart to Purchase.
Step 3.1.1: In the Event Name section, provide a clear and descriptive name for the event you want to monitor. Click Add Event.
Step 3.1.2: Under the Check Type dropdown, the following options are available:
· LESS_THAN
· GREATER_THAN
· LESS_THAN_EQUAL_TO, and
· GREATER_THAN_EQUAL_TO.
For example, if you specify 60% in the Value section and select LESS_THAN from the dropdown, a notification will be sent if the monitored percentage falls below 60%. Similarly:
· GREATER_THAN will send a notification if the percentage exceeds 60%.
· LESS_THAN_EQUAL_TO will trigger a notification if the percentage is 60% or lower.
· GREATER_THAN_EQUAL_TO will send a notification if the percentage is 60% or higher.
Step 3.2: Click Occurrence.
Step 3.2.1: In the Event Name section, provide a clear and descriptive name for the event you want to monitor.
Step 3.2.2: Under the Select Threshold Type dropdown, the following options are available:
LESS_THAN
GREATER_THAN
LESS_THAN_EQUAL_TO
GREATER_THAN_EQUAL_TO
In the Value section, specify the numeric threshold you want to monitor. For example, if you select LESS_THAN and enter a value of 50, the alarm will trigger when the monitored percentage falls below 50%. Similarly:
· Selecting GREATER_THAN will trigger the alarm when the value exceeds the specified threshold.
· LESS_THAN_EQUAL_TO will activate the alarm when the value is equal to or less than the threshold.
· GREATER_THAN_EQUAL_TO will trigger the alarm when the value is equal to or greater than the threshold.
Step 4: Time Window.
Choose how sensitive you want your alarm to be by configuring the time window settings.
Under the Unit dropdown, the following options are available:
HOUR
DAY
WEEK
MONTH
In the Value field, specify a numeric value that corresponds to your selected unit. For example:
· If you enter 2 in the Value field and select HOUR from the dropdown, the alarm will monitor events within a 2-hour time window.
· Similarly, choosing DAY with a value of 1 will set the alarm to monitor events within a 1-day period.
Step 5: Destinations.
Under the Notification Groups dropdown, you can select the groups that should receive the notification. By choosing a specific group, all members of that group will be alerted when the alarm is triggered.
Under Email IDs, if you want to send the notification to a specific email address in addition to the selected groups, you can enter the email address here. This allows you to add a new user or ensure that a particular individual receives the notification directly.
Production
Staging
The Staging section displays all the publish info.
When an element is published, it remains in the Pending Publish state and is listed in the Publish to Staging section.
Note: This can be any element.
Click Publish to Staging.
Select the required element and click Review.
In the Name field, enter the element name.
In the Description field, enter the description.
Click Publish to Staging.
Result: The element is in the Staging state.
Production
The Production section displays the elements that are pushed from the Staging section. Then, you can publish the elements to Production, so they go live.
Note: Pending to Publish change is visible on the dashboard in about 4-5 mins for client-side tags after the CDN cache for client SDK is cleared. For server-side tags, it is almost immediate.
This option indicates the number of Publish items currently displayed out of the total available Publish items. You can adjust the number of Publish items displayed per page using the dropdown menu located at the top-right corner of the screen.
50 per page: Displays up to 50 Publish items on the current page.
100 per page: Displays up to 100 Publish items on the current page.
200 per page: Displays up to 200 Publish items on the current page.
Click the Refresh.
A Fetching Data Elements… message appears while the system retrieves and displays the updated data.

Add Alarms Click the Alarms dropdown. You will see the following options:
Add Tag Anomaly Detection Alarm
Add Tag Expiration Alarm
Add Funnel Monitoring Alarm
Details of each option will be explained in their respective documents.
Click the Refresh A Fetching Alarms… message appears while the system retrieves and displays the updated alarm data.
The following UI elements appear on the Alarms screen.
Name
Denotes the Alarm Name.
Alarm Status
Denotes the Alarm status.
Monitoring Type
Denotes the type of monitoring applied to generate the alarm.
Created By
Denotes the user who created the alarm.
Updated By
Denotes the user who updated the alarm.
Updated On
Denotes the time and the date of the last update of the alarm.
You can configure one or both of these alarms:
Tag Anomaly Detection Alarm: To notify contacts when tag anomalies occur.
Tag Expiration Alarm: To notify contacts when a tag expires.
In Ingest Labs, you can create an alarm for tag expiration and anomaly detection. The configured contacts will receive an alert when an abnormal tag trigger is detected or when a tag expires. You can also set an advance notification for tag expiry using the Tag Expiry Look Back feature.
Step 2: At the top-right corner, the Actions drop-down is available. Click the drop-down and select Edit.
Step 3: Edit the alarm details and click Save on the top right to save the changes.
Step 4: You will see a message saying the alarm updated successfully.
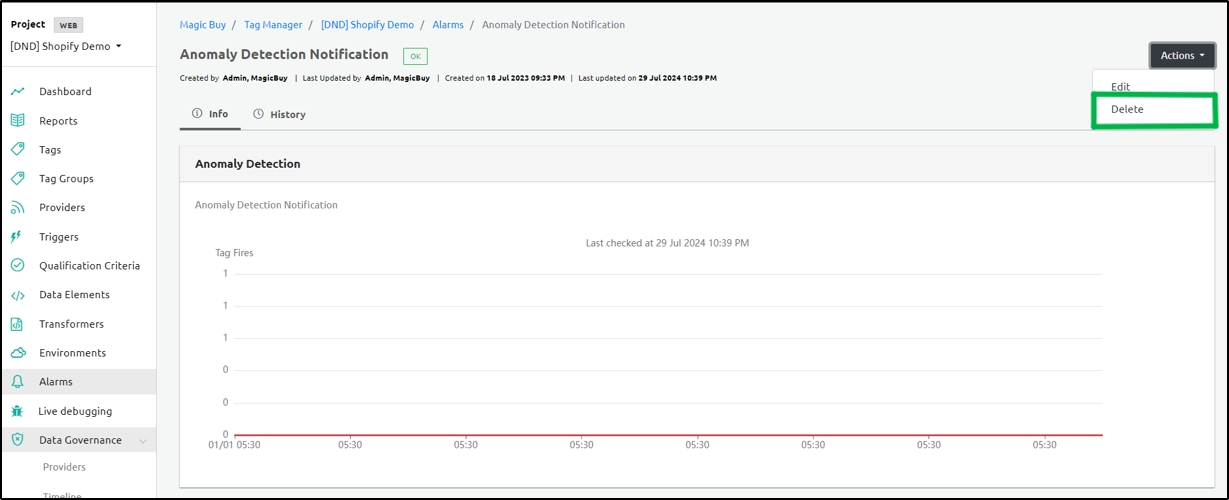
Step 2: At the top-right corner, click the Actions drop-down and choose Delete.
Step 3: Click Yes on the confirmatory message that appears.
Step Result: The alarm is deleted successfully.
Please rate this document to help us improve the content


To view the Staging Environment, select the Staging option on the Environments screen.
Under the Name field, click Staging.
The Info section includes the following information.
Name: Displays Staging, indicating the environment type.
Description: Displays Staging Environment, which gives more details about the selected environment.
Click Edit.
Denotes the specific event that will be used to trigger the tag.
Specifies the condition that activates the tag. You can choose from the following options:
On Page Interactive – Triggers the tag when the page becomes interactive (for example, when the DOM is fully parsed and ready for user interaction).
On Page Loaded – Triggers the tag as soon as the page is loaded.
Custom Page Event – Allows you to define a custom event that triggers the tag.
Select this checkbox to enable a secondary trigger.
Once enabled, two additional fields appear:
Variable Name – Specify the JavaScript variable that acts as the secondary trigger.
Wait Time – Enter the in milliseconds that the system should wait before triggering the secondary action.
Determines how the cookie domain is set. Two options are available:
Auto – The cookie domain is automatically detected at runtime.
Manual – Allows you to manually specify the cookie domain.
Note: The cookie domain is automatically detected at runtime, so you don’t need to configure it manually.
Provides options to capture and report SDK errors on the client side.
Report Client-side SDK Errors – Select this checkbox to allow the Client SDK to report errors and exceptions to the Ingest Labs servers.
Enable Logging for Client-side SDK – Select this checkbox to capture and log client-side SDK activities locally for troubleshooting.
With Trigger Delay, you can set how long, in milliseconds, the system should wait after the page loads before firing the tag.
Note: Allows the page to render its content before the Tag Manager is fired, ensuring that all necessary elements are available.
This allows the client to add an additional CSP field so we can use the same csp field to add scripts to the website - Else, it will fail. Select this check box to enable or disable this option. If Enabled, the following option is available.
Meta tag attribute name for Nonce: The Attribute name in meta tag where the Nonce value is configured in the website.
To set up Ingest Labs SDK, you must include the following script tag in index.html file of the website. Once the script is executed, the SDK is installed on the client website.
The following is the SDK URL that you must embed in the Staging environment of the client website. The first party domain is mp.ingestlabs.com and the Project ID in the sdk url is MPcl02kskp1eha030nh7hnn. In the IDL Setup, the idl.js file is Identity Link or First party identity script file. The following is the IDL setup url that you must embed in the Staging environment of the client website:
The Approved Domains has the list of domains on which the SDK will run. The SDK will execute only these listed domains. This is to avoid spamming and to ensure that the SDK of one site is not used on another site.
The Script sdk url changes when the domain is verified based on the data collector configuration. This decides which collector url to pick based on what domain. Collector url is the url to which Server Side Tags and report calls are sent.
The Approved Domains & Collector URLs display the following information:
Domain – Enter your website domain in this field.
Collector URL – This displays the URL where the collected data is sent.
Approved Data Collection Domains – This section lists the domains that are authorized to collect data.
This option allows users to create a new Tag Expiration Alarm. It helps monitor tags and notifies users when a tag is about to expire, enabling timely action.
To add a new alarm, perform the following steps:
Step 1: Select Alarms from the left navigation panel.
Step 2: Click Add Alarm on the top-right corner of the screen.
Step 3: Select Tag Expiration Alarm.
Step Result: The New Tag Expiration Alarm screen appears.
Step 4: Enter the following details in the New Tag Expiration Alarm screen.
Step 5: In the Name field, enter the alarm name. In the Description field, enter the alarm description.
Step 6: In the Metadata Filters, select a key.
Step 7: Under the Enter Value field, enter the corresponding value.
Step 8: The entered values will appear under Selected Values.
Step 9: To clear the selected values, click Clear.
Step 10: To delete an entry entirely, click Delete.
Note: You can add multiple filters by clicking Add.
Settings
Step 11: Enter the details mentioned in the Settings section.
a. Tag Expiry Lookback (in Days): Send tag expiration notification before the tag expires. You can choose five durations during which the alert should be sent. The number of days must be between 1-180.
b. Report Time: Select the time to trigger the tag expiration alarm. The timezone is set according to the user time zone.
Destination.
Step 12: Select Notification Group: The tag expiration alert is sent to the contacts configured in the selected notification group. In this step, you can select the check boxes or search for a particular group.
Step 13: Provide Email ID: Enter the e-mail IDs to send the tag anomaly notification. You can add users using the Add Users tab.
Note: You can select Notification Groups, Email IDs, or both, based on where you want to send the alerts.
Step 14: Click Save to save the settings.
Step 15: A message appears confirming that the alarm was added successfully.
This section describes the Transformers UI screen elements.
This option indicates the number of Transformers currently displayed out of the total available Transformers.
This option indicates the number of Transformers currently displayed out of the total available Transformers. You can adjust the number of Transformers displayed per page using the dropdown menu located at the top-right corner of the screen.
50 per page: Displays up to 50 Transformers on the current page.
100 per page: Displays up to 100 Transformers on the current page.
200 per page: Displays up to 200 Transformers on the current page.
Click the Transformers dropdown. You will see two options: For Server and For Browser. Select the required option.
The Filter Transformers option is based on the following types:
Filter By Name: Filters the Transformers based on the trigger name.
Filter By Attribute Value: Filters the Transformers based on Attribute Value.
Filter By Metadata Attribute: Filters the Transformers based on Metadata Attribute.
Click the Refresh.
A Fetching Data Elements… message appears while the system retrieves and displays the updated data.
Media Data Platform Dashboard
The Media Data Platform (MDP) Dashboard visually represents the customer data when you log in to the MDP. It displays the conversion data using customizable dimensions and metrics. Conversion refers to the conversion of a prospective customer into an actual customer. Ingest Labs creates a default dashboard for the new MDP users soon after the users are onboarded.
Domain
Select the appropriate domain name. Select either contains or is from the Operator drop-down menu.
Status
Select this option to set to one of the Tag Fire Statuses. • Success (200) • Success (202) • Provider Side Failure (400) • Provider Side Failure (404) • Provider Side Failure (500) • Tag Validation Failure (900) • Tag Validation Failure (1000) • Error (1001) • Privacy Blocked (1002) • Skipped (1003) • Success with Warnings (1004) • Scheduled for retry (1005) • Maximum retry attempts reached (1006) • Delayed (1007)


Step 1: Click Add Widgets.
Step 2: The following visualization types are available:
Line Chart: Displays data trends over time by connecting individual data points with a line.
Tags Fired Counter: Counts and displays the number of times specific tags have been triggered.
Pie Chart: Represents data proportions as slices of a circular chart, showing relative sizes.
Select the appropriate chart type.
Step 3: Under the Select Aggregation Attribute section, click the Select Attribute dropdown. The following options will be displayed:
Browser
Device Type
Language
Tag Fire Status
Browser
Select this option to display information regarding the Browser types such as Chrome, Safari, Edge, IE, Firefox, Opera, and Other.
Device Type
Select this option to display the device type such as Desktop Web, Mobile Web, Tablet, and Other.
Language
Select this option to set the preferred language. The available languages are English, Spanish, and Other.
Tag Fire Status
Select this option to set to one of the Tag trigger Statuses.
• Success (200)
• Success (202)
• Provider Side Failure (400)
• Provider Side Failure (404)
• Provider Side Failure (500)
• Tag Validation Failure (900)
• Tag Validation Failure (1000)
• Error (1001)
• Privacy Blocked (1002)
• Skipped (1003)
• Success with Warnings (1004)
• Scheduled for retry (1005)
Step 4: Click Add Filter and select the various criteria to filter information.
Note: This step is optional and can be skipped if no filtering is needed.
Tag
Specifies the tag that needs to be filtered.
Page Name
Specifies the Page Name. Select either contains or is from the Operator drop-down menu.
Provider
Specifies the Provider that needs to be filtered.
Device Type
Select this option to display the device type such as Desktop Web, Mobile Web, Tablet, and Other.
Browser
Select this option to display information regarding the Browser types such as Chrome, Safari, Edge, IE, Firefox, Opera, and Other.
Language
Select this option to set the preferred language.
Step 5: Click the Operator dropdown.
The following options will be available:
Is one of: Select this operator to filter data where the field matches any of the values in the specified list.
Is not one of: Select this operator to filter data where the field does not match any of the values in the specified list.
Step 6: When you select the Operator , a tab opens below. Click the arrow in the tab to select the filter for a specific field type.
Step 7: Click Add Filter to add the filter conditions.
Step 8: Enter the Widget Name and Description under the Widget Info section and click Save.
Step Result: The new widget is added successfully.
The Dashboard screen displays the required filtered information for a default period of 24 hours. You can also specify a time range to display the information for a specific period and click Refresh.
Note: You can perform the same steps as explained in this procedure for the Tags Fired Counter and Pie Chart.
This option indicates the number of Qualification Criteria currently displayed out of the total available Qualification Criteria.
This option indicates the number of Qualification Criteria currently displayed out of the total available Qualification Criteria. You can adjust the number of Qualification Criteria displayed per page using the dropdown menu located at the top-right corner of the screen.
50 per page: Displays up to 50 Qualification Criteria on the current page.
100 per page: Displays up to 100 Qualification Criteria on the current page.
200 per page: Displays up to 200 Qualification Criteria on the current page.
Click the Qualification Criteria dropdown. You will see two options: For Server and For Browser. Select the required option.
The Filter Qualification Criteria is based on the following types:
Filter By Name: Filters the Qualification Criteria based on the trigger name.
Filter By Attribute Value: Filters the Qualification Criteria based on Attribute Value.
Filter By Metadata Attribute: Filters the Qualification Criteria based on Metadata Attribute.
The Filter by Data Elements option filters the Qualification Criteria based on the Data Elements.
Click Filter by Data Elements.
The Choose Data Elements panel opens on the right side of the screen.
You will see two tabs: User-defined and Default.
Select the required Data Elements from either tab or use the search bar to find specific Data Elements.
You can select multiple Data Elements as needed.
After selecting the Data Elements, click Done to apply the filter.
Deselect: To remove a selected Data Element, click the small x icon next to it.
Click the Refresh.
A Fetching Data Elements… message appears while the system retrieves and displays the updated data.
Reset Filters:
Click this to clear all applied filters and restore the default view.
Name
Denotes the Qualification Criteria Name.
Support
Denotes whether the Qualification Criteria is a server-side or a browser-side setting.
C stands for Client-side
S stands for Server-side.
Status
Denotes the status of the Qualification Criteria. • Production: The Qualification Criteria is in Production status. • Staging: The Qualification Criteria is in Staging status. • Pending Publish: The Qualification Criteria is yet to be Published.
Created By
Denotes the user who created the Qualification Criteria.
Updated By
Denotes the user who updated the Qualification Criteria.
Updated On
Denotes when the Qualification Criteria is last updated.
To add a tag, follow these steps:
Click Add Tag.
The Select Provider panel opens on the right side of the screen.
In the panel, you can select a provider from the list or use the search bar to find a specific provider.
After selecting the required provider, complete the tagging process as needed. For further details, refer to the Tag section.
Updated On
Denotes when the Data Element is last updated.


Domain
Select the appropriate domain name. Select either contains or is from the Operator drop-down menu.
Status
Select this option to set to one of the Tag trigger Statuses. • Success (200) • Success (202) • Provider Side Failure (400) • Provider Side Failure (404) • Provider Side Failure (500) • Tag Validation Failure (900) • Tag Validation Failure (1000) • Error (1001) • Privacy Blocked (1002) • Skipped (1003) • Success with Warnings (1004) • Scheduled for retry (1005) • Maximum retry attempts reached (1006) • Delayed (1007)


Name
Denotes the Transformer Name.
Type
Denotes whether the Transformer is a server-side or a browser-side setting.
Status
Denotes the status of the Transformer. • Production: The Transformer is under production. • Staging: The Transformer is in Staging. • Pending Publish: The Transformer is yet to be published.
Created By
Denotes the user who created the Transformer.
Updated By
Denotes the user who updated the Transformer.
Updated On
Denotes when the Transformer is last updated.


Please rate this document to help us improve the content


You can add a new tag to capture browser or client-side data. This helps in tracking specific user interactions or behaviors based on browser activity.
To add a new Tag for browser/client-side, perform the following steps:
Step 1: Select Tags from the left navigation panel.
Step 2: Click the Add Tag dropdown in the top right, then select For Browser from the list.
Step 3: The Select Provider panel opens on the right side. You can choose a provider from the list or use the search bar to find and select a provider.
After selecting a provider, the Tags screen opens.
Step 4: Select Trigger
Step 4.1: In Triggers, click Choose Trigger.
Step 4.2: The Choose Triggers panel opens with two tabs:
User-Defined: Displays custom triggers created by users.
Default: Contains predefined system triggers.
Step 4.3: Select a trigger from the list or use the search bar to find and select a trigger.
Note: Multiple triggers can be selected.
Step 4.4: Click Done.
The selected trigger appears on the Triggers screen.
Note 1: You can remove the selected trigger by clicking the Clear button or click the small cancel icon next to each trigger to remove them individually.
Note 2: If mandatory details are not filled in, the following warning message gets triggered:
Step 5: Qualification Criteria (Optional)
The Qualification Criteria are the conditions/triggers that inform Ingest Labs when to trigger a particular tag. You can add multiple Qualification Criteria, and these criteria are layered.
Step 5.1: Click Qualification Criteria (Optional).
Step 5.2: The Qualification Criteria panel opens on the right side.
Select a qualification criterion from the list or use the search bar to find and select one.
You can select multiple qualification criteria.
Step 5.3: Click Done.
The selected qualification criteria appear on the Qualification Criteria (Optional) screen.
Note: You can click Clear to remove all selected qualification criteria at once, or click the small cancel icon next to each one to remove them individually.
Step 6: Tag Info
You can set the tag name and validity period. The default validity period is one year for any new tag and can be set to any desired date. To understand tag validity or expiry, see the section Set the Validity period and Tag Expiry.
Step 6.1: Name: The Tag name.
Step 6.2: Validity Period: Denotes the Tag Validity period including Start Date and End Date.
Set Validity and Tag Expiry
While creating a tag in Tag Manager, you can set the validity period of a particular tag and define its expiry. The default validity period is one year for any new tag and can be set to any desired date. When the expiry date is close, you will receive a reminder e-mail notification about the tag expiry. If no action is taken, the tag stops triggering post the set validity period.
See ExpirationAlarm for more information.
Step 7: Set Provider Attributes
The Provider is a mandatory setting while adding a new tag. You can add any number of Provider attributes using the Key-Value pair and configure the settings using the Settings option. For a particular Provider attribute, you must set the value either from the Data Elements or Transformers. The user can view the provider attributes added from Provider side configuration.
Step 7.1: If you do not set the mandatory values, the following message appears:
Step 7.2: After selecting either from the Data Element or Transformer, the value appears in the Value column.
Step 8: Set Tag Attributes
To add Attributes, select Add Attributes and set the following values.
Step 8.1: Name: Set the Attribute name. For example: visitor_id, user_id, and so on.
Step 8.2: Value: Set the value either for the Data Element or Transformer.
JSON: Enter the Attribute name and value, and configure the Settings.
Mandatory - Denotes the value to be mandatory.
Ignore If Empty - Ignore the field if empty.
Hash (SHA256) - denotes the value in the HASH format.
Static: Denotes the static Value that is known.
Step 8.3: Attribute Settings
Enter the Attribute Settings.
Step 8.4: Tool-tip! Select the Mandatory check box to display the Fatal check box.
Step 8.5: Set the Data Type Conversion using the following options.
Step 8.6: Select one of the following Transformer types and click Confirm.
Step 8.7: Select the Ignore Redaction checkbox to display the data elements. Redaction is a setting for each data element, which allows the server-side processing to apply the redaction strategy - like anonymize for email.
Step Result: The Provider Attribute is created.
To delete the Provider Attribute, select the Delete icon at the right-hand corner of the screen.
Step 9: Denote the Script.
The Script denotes the code script if available for the tag. Select the No Script check box if the script is unavailable.
This section describes the Providers screen UI elements.
To create a new Provider, click on the Add Provider option located at the top-right corner of the screen.
You can filter the Providers based on the following types:
Filter By Name: Filters the providers based on the Provider name.
Filter By Attribute Value: Filters the Providers based on Attribute Value.
Filter By Metadata Attribute: Filters the Providers based on Metadata Attribute.
You can adjust the number of providers displayed per page using the dropdown menu located at the top-right corner of the screen.
50 per page: Displays up to 50 providers on the current page.
100 per page: Displays up to 100 providers on the current page.
200 per page: Displays up to 200 providers on the current page.
The following are the additional fields that appear on the Providers screen.
The All-Provider Types drop-down menu displays the following provider types:
All Provider Types
Image Tags: Providers that use image-based tracking.
JS Tags: Providers that use JavaScript for tracking.
The Filter By Data Elements option filters the Data Elements based on the Data Element selected.
The Choose Data Elements panel opens.
You can either:
Use the Search bar at the top to find specific Data Elements, or
Browse through the two available tabs:
User Defined: Custom Data Elements created by users.
Default: Predefined Data Elements available in the system.
Note: You can choose a combination of both User Defined and Default Data Elements.
Deselect: To remove a selected Data Element, click the small x icon next to it.
Refresh: Click the Refresh button to load the most recent Data Elements.
A Fetching Data Elements... message appears while the system retrieves and displays the updated data.
Once you’ve finished selecting, click the Done button to apply your choices.
The Reset Filters option resets the applied filters.
Refresh Button The Refresh button allows you to reload the Providers screen. If you create new providers or update their properties and the changes are not immediately visible on the main UI screen, clicking the Refresh button will reload the page to display the most up-to-date information.
Click the Add Tag button to add a new tag.
Note: For detailed steps on adding tags, please refer to the Tags section of this document.
Server-side tagging lets you shift tag execution from your website or app to a secure server environment. Instead of loading multiple tags in the browser, data is sent to a server where tags are triggered. This improves site speed, enhances data accuracy, and gives you more control over what data is shared with third parties.
To add a new server-side tag, perform the following steps:
Step 1: Select Tags from the left navigation panel.
Step 2: Click the Add Tag dropdown select For server.
Step 3: The Select Provider panel opens on the right side. Select a provider from the list or use the search bar to find and select a provider.
Step Result: The New tag screen appears.
Step: 4: Trigger.
Step 4.1: Click Choose Triggers.
Step 4.2: The Choose Triggers panel opens on the right side. Choose a trigger from the list or use the search bar to find and select a trigger, then click Done.
Note: You can select multiple triggers if needed.
Step Result: The tag is triggered for the respective trigger data.
Step 5: Set Qualification Criteria (Optional).
Step 5.1: Click Qualification Criteria (Optional).
Qualification Criteria of a tag are conditions/triggers that inform Ingest Labs when to trigger a particular tag. You can add multiple Qualification Criteria and these criteria are layered.
Note 1: This step is optional.
Step 5.2: The Choose Qualification Criteria panel opens on the right side. Select an option from the dropdown or use the search bar to find and select a criterion, then click Done.
Note 2: You can select multiple qualification criteria if needed.
Step 6: Set Tag Info
This is the step where you set a name and validity period for the tag. The default validity period is one year for any new tag that is created and can be set to any desired date.
Step 6.1: Name: The Tag name.
Step 6.2: Validity Period: Denotes the validity period of the tag including Start Date and End Date.
Note : If you don't enter the tag name, an error message appears: This value is required.
Set Validity and Tag Expiry
While creating a tag on Ingest Labs, you can set the validity period of a particular tag and define tag expiry. The default validity period is one year for any new tag that is created and can be set to any desired date. When the expiry date is closer, you will receive reminder e-mail notification about the expiry of the tag. If no action is taken, the tag stops triggering post the set validity period. You can find all expired tags in the “Paused State” in the Publish section and you can remove the expired tags to reduce the size of your SDK.
Set Tag Query Parameters
The Query parameters include the set of dynamic values that are included along with the Base URL while executing the query. These parameters appear in the Attributes section as well along with the values.
Step 7: Set Provider Attributes
The Provider is a mandatory setting while adding a new tag. You can add any number of Provider attributes using the Key-Value pair and configure the settings using the Settings option. The user can view the providers attributes added from Provider side configuration.
For a particular Provider attribute, you must set the value either from the Data Elements or Transformers.
After selecting either from the Data Element or Transformer, the value appears in the Value column.
Step 7.1: Add Attributes
To add Attributes, select Add Attributes and set the following values.
Step 7.1.1: Name: Set the Attribute name. For example: visitor_id, user_id, and so on.
Step 7.1.2: Value: Set the value either for the Data Element or Transformer.
Step 7.1.3: JSON: Enter the Attribute name and value, and configure the Settings.
Mandatory - Denotes the value to be mandatory.
Ignore If Empty - Ignore the field if empty.
Hash (SHA256) - denotes the value in the HASH format.
Step 7.1.4: Static: Denotes the static Value that is known.
Step 7.1.5: Attribute Settings:
Enter the Attribute Settings.
Tool-tip! Select the Mandatory check box to display the Fatal check box.
Step 7.1.6: Set the Data Type Conversion using the following options.
Step 7.1.7: Select one the following Transformer types and click Confirm.
Step 7.1.8: Select the Ignore Redaction checkbox to display the data elements. Redaction is a setting for each data element, which allows the server-side processing to apply the redaction strategy - like anonymize for email.
Step Result: The Provider Attribute is created.
Step 7.1.9: To delete the Provider Attribute, select the Delete icon at the right-hand corner of the screen.
Step 7.1.10: Click Save to save the settings.
Step Result: The new tag is created.
This document provides step-by-step guidance on adding a new data element for server-side configuration.
Perform the following steps to create the Data elements on browser:
Step 1: Click the Add Data Element dropdown and select For Server.
Step 2: Under the Info section, enter the following details in the respective fields:
Step 3: Click Server Cookie.
Step 3.1: Cookie Name: Enter the name of the cookie. This field is mandatory.
Step 3.2: Default Value:
Select the Default Value from the drop-down. If the value for a particular data element is unavailable, the default value is used.
Undefined: If the data element is not supposed to be used then select Undefined.
Empty String: Denotes that the data element is a string value.
Null: Denotes the Null data type for the data element.
Custom Value: Denotes the static value for the Data Element.
Step 3.3: Data Classification
Choose Data Classification:
Select the appropriate classification for the data the element represents:
Not Applicable
Phone Number
IP Address
Step 3.3.1: Redaction Strategy:
When you select Email, Phone Number, IP Address, or Date, an additional option appears:
Choose how the sensitive data should be handled:
Not Applicable
Anonymize: Masks or transforms the data to anonymize it.
Step 4: Click Server Header.
Step 4.1: Header Name: Enter the name of the server header. This field is mandatory.
Step 4.2: Default Value: Choose a fallback value if the actual data is unavailable:
Undefined: If the data element is not supposed to be used then select Undefined.
Empty String: Denotes that the data element is a string value.
Null: Denotes the Null data type for the data element.
Custom Value: Denotes the static value for the Data Element.
Step 4.3: Redaction
Data Classification
Choose Data Classification:
Select the appropriate classification for the data the element represents:
Not Applicable
Phone Number
IP Address
Step 4.3.1: Redaction Strategy
When you select Email, Phone Number, IP Address, or Date, an additional option appears:
Choose how the sensitive data should be handled:
Not Applicable
Anonymize: Masks or transforms the data to anonymize it.
Step 5: Click Json path
Step 5.1: Enter the name of the JSON path data element. This field is mandatory.
Step 5.2: Default Value:
Undefined: The data element will not be used.
Empty String: Sets the value as an empty string.
Null: Assigns a null value to the data element.
Custom Value: Enter a static value to use by default.
Step 5.3: Clean Clean: Clears and trims any white spaces on the trailing and leading strings after collecting the data value.
Step 5.4: Lowercase: Denotes that the string needs to be in lower-case.
Step 5.5: Redaction
Choose Data Classification:
Select the appropriate classification for the data the element represents:
Not Applicable
Phone Number
IP Address
Step 5.5.1: Redaction Strategy:
When you select Email, Phone Number, IP Address, or Date, an additional dropdown appears:
Not Applicable: No redaction is applied.
Anonymize: Personally identifiable information is masked or transformed.
Step 6: Once all the required fields are filled in, click Save
The Live Debugging feature in Ingest Labs displays all the tags that are triggered in real-time on a particular page. You can perform live debugging for both the server-side tags and browser-side tags. The event data is populated in the live debugging section.
There are two environments present:
Production – When elements are pushed to the production environment, you can check the live details in the production environment.
Staging – When elements are pushed to the staging environment, you can check the live details in the staging environment.
Step 1: Select Production from the drop-down.
Note: When elements are pushed to the staging environment, you can check the live details in the staging environment.
Step 2: Click the Start Debugging button.
Step 3: The Start Live Debugging popup window opens. Without entering a Debug ID, click Start.
Step 4: The Live mode option is displayed with a red dot indicator. You can view all the events firing in real-time traffic on the website.
Step 4.1: To stop debugging, click the Live mode drop-down and select Stop Debugging.
Step 4.2: To clear the debugging session, click the Live mode drop-down and select Clear.
Step 5: Click on View request of any SS tag to view API call request/response body.
Step 5.1: The Tag Request Details popup window opens. You can view the following tag details:
Tag URL – displays the tag URL.
Tag URL Query Parameters Assignment – displays the query parameters associated with the tag.
Step 5.2: Click Data Elements to view the data element details.
Step 5.3: Click Request Body to view the details of the request body.
Step 5.4: Click Response Body to view the details of the response body.
The following are the additional fields that appear on the Live Debugging screen.
Note 1: You can perform the Live Debugging in two ways, either through the console or through a Live Debugging session on Ingest Labs.
Note 2: Use the pagination control at the bottom of the page to navigate through multiple pages. The current page is highlighted in blue.
Step 6: Click Add Filter. The Add Filter panel opens on the right side
Step 6.1: Under Field, click Select Field drop-down and choose the required field.
Step 6.2: Under Operator, click the Select an Operator drop-down. You will see two options:
is one of
is not one of
Step 6.3: After selecting an operator, a list opens. Select one or multiple values as needed.
Step 6.4: Click Add Filter to apply the filter.
Note: Click Cancel to close the panel without saving any changes.
The Live Debugging section includes the following topics:
The Dashboard screen is customisable and can include the following details:
Total Conversions
Total number of conversions (for example, purchases)
Total Sales
Total sales value
Total Sales - KartMax
The total sales or conversion value in Kartmax
Average Order Value (AOV)
The average value of the conversions or the orders
By default, the Dashboard is set to display the data for the last 7 days. To view the data for a different time duration, you must set the time range from the Last 7 days tab on the top of the page and click Refresh.
To view the data for a custom duration, select the start date from the 7 days ago tab and the ‘end date’ from the Now tab at the top of the screen and click Refresh.
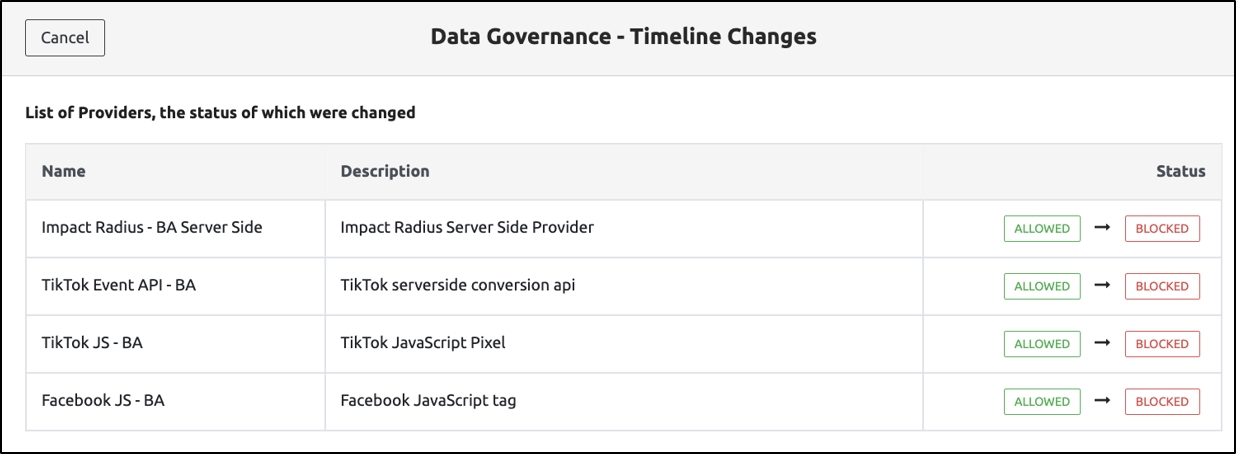
This document provides detailed instructions to help customers onboard with Ingest Labs - Staging through the Shopify platform.
Step 1: Open a web browser and go to the following Shopify App Store link:
Step 2: Open a web browser and navigate to the following Shopify App Store link:
Step 3: You will see the Ingest Labs app listed as Server-Side Tag Manager. Click Install to begin the installation process.
Step 4: You will be redirected to the Shopify home page, and the Ingest Labs installation window will open. Click Install to proceed with the app setup.
Step 5: Welcome to Ingest Labs page will open. Your email and password will be pre-filled on the login screen. Click Login to access your Ingest Labs account.
Step 6: The Select an existing Organization page will open. In the Select an organization dropdown, you will see a list of available organizations. From the dropdown, select Ketch. Click Proceed to continue.
Step 7: The Domain DNS Mapping screen will open. Click Initiate Onboarding to begin the onboarding process.
Step 8:


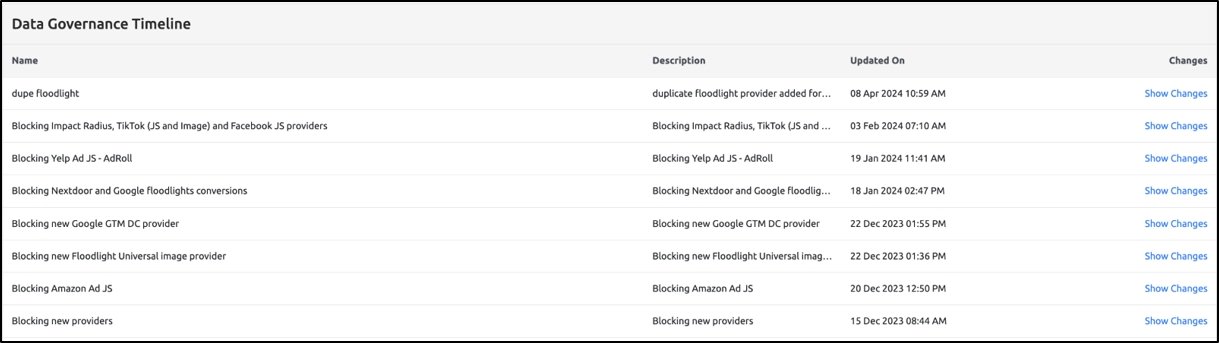
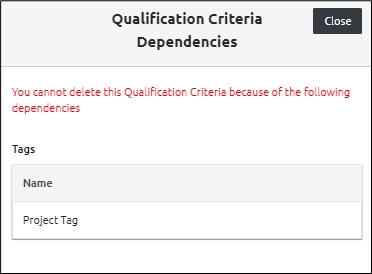

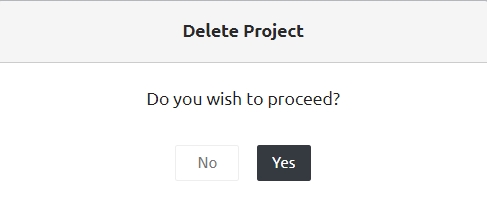
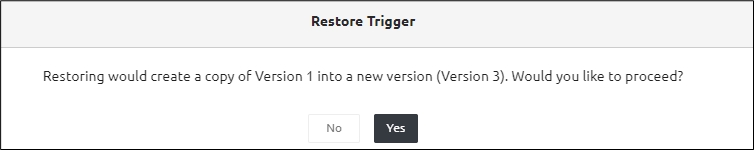
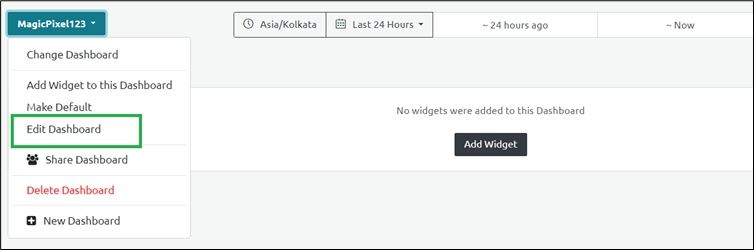
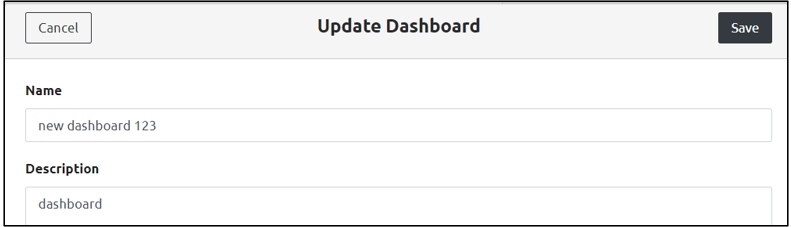


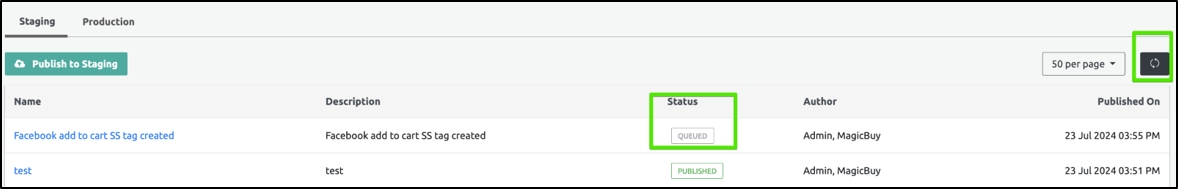
Updated On
Denotes when the Provider is last updated.
Add Tag
You can create the tag using this option from the Providers.
Name
Denotes the Provider Name.
Support
Denotes whether the Provider is a server-side or a browser-side setting.
Status
Denotes the status of the Provider. • Production: The Provider is in Production status. • Staging: The Provider is in Staging status. • Pending Publish: The Provider is yet to be Published.
Type
Denotes the type of the Provider. For example, IMG, JS, and so on.
Created By
Denotes the user who created the Provider.
Updated By
Denotes the user who updated the Provider.


Name
The Default Data Element Name.
Variable Name
Denotes the variable name. Note: The Variable name is same as the Data Element name.
Description
Enter the description of the Data Element.
Choose Data Element Type
Select the appropriate data element type based on your requirements:
Server Cookie: Retrieves data from server-side cookies.
Server Header: Fetches data from HTTP headers sent by the server.
JSON Path: Extracts data from JSON responses using a specified JSON path.


Status
Displays the tag status, indicating whether the tag is successfully triggered or not.
Event Time
Displays the event time-stamp.
Page Name
The page from which the tag is triggered.
Provider
Displays the Provider details.
Tag
Displays the Tag details.
Platform
Displays the Platform from which the page is accessed.
Domain
Shows the domain from which the tag is triggered.


• Delayed (1007)
Domain
Select the appropriate domain name. Select either contains or is from the Operator drop-down menu.
Status
Select this option to set to one of the Tag trigger Statuses. • Success (200) • Success (202) • Provider Side Failure (400) • Provider Side Failure (404) • Provider Side Failure (500) • Tag Validation Failure (900) • Tag Validation Failure (1000) • Error (1001) • Privacy Blocked (1002) • Skipped (1003) • Success with Warnings (1004) • Scheduled for retry (1005) • Maximum retry attempts reached (1006) • Delayed (1007)
Please rate this document to help us improve the content


Step 1: Click the Add Data Element dropdown and select Browser.
Step 2: Under the Info section, enter the following details in the respective fields:
Name
Denotes the default Data Element Name.
Variable Name
Denotes the variable name. Note: The Variable name is the same as the Data Element name.
Description
Enter the description of the Data Element.
Is a Language Data Element?
The language that must be essentially used in the particular website. There can be only one Language Data Element for a particular Data Element.
Is a Privacy Compliance Data Element?
Denotes if the user or customer has provided consent for data collection. There can be only one Privacy Compliance Data Element for a particular Data Element.
Choose Data Element Type
Denotes the data element type. • URL Parameter: Denotes the parameters that are fetched from the URL. • Launch Data Element: This is a reference to the Adobe Launch data element if the client's website has Adobe launch configured and the Adobe launch SDK downloaded on their website. • Custom JavaScript: Includes the Custom Java Script code that the user provides as input. The code must be included in the Custom Java Script section while adding the Data Elements. • Ingest Labs Data Layer: Includes the Data Layer that the Ingest Labs generates. You can specify the path in the Element Name that is a JSON object and provide values.
Step 3: Under Data Element Type, there is a dropdown labeled Choose Data Element Type. The available options are:
URL Parameter
Launch Data Element
Custom JavaScript
Ingest Labs Data Layer
Step 3.1: URL Parameter:
Parameter Name
This is a mandatory field. Enter the parameter name.
Default value
Represents the Default Value of the parameter. • Empty String: Denotes that the data element is a string value. • Undefined: If the data element is not supposed to be used then select Undefined. • Null: Denotes the Null data type for the data element. • Custom Value: Denotes the static value for the Data Element.
Case-sensitive
Select the Case-sensitive check box to make the default parameter case-sensitive. Else, clear the check box.
Step 3.1.1: Transformation Function
Enter the following fields in the Transformation Function section.
Default Functions
• Clean: Clears and trims any white spaces on the trailing and leading strings after collecting the data value. • Lowercase: Denotes that the string needs to be in the lower-case.
Custom Function
Use Custom Function: For performing other transformations, you can write the code, retrieve or convert the value into a new value, and return the new value in the code using Custom function.
Step 3.1.2: Redaction
Select the Redaction option for the data element if it contains sensitive information. When redaction is enabled and a strategy is applied, the backend server will scramble or mask the data when it is used in a tag or provider to maintain privacy.
Data Classification:
Under the Redaction section, click the Data Classification dropdown and choose the appropriate classification type based on the data element. The available options are:
Not Applicable – No redaction strategy is applied.
Email – Digits in the email are scrambled.
IP Address – The last octets of the IP address are zeroed out.
Phone Number – The first 3 digits are retained; the remaining digits are set to 0.
Date – The month and year are kept; the date is set to 1.
Step 3.1.3: Storage Duration
In the Storage Duration field, select how long the data element should be retained. The available options are:
EVENT – The data is stored only for the duration of the event.
NONE – The data is not stored.
SESSION – The data is stored for the duration of the user session.
VISITOR – The data is stored across multiple sessions for the same visitor.
Step 3.2: Launch Data Element
Enter the following fields in the Launch Data section of the screen.
Element Name
This is a mandatory field. Enter the data element name.
Default value
Represents the Default Value of the data element. • Empty String: Denotes that the data element is a string value. • Undefined: If the data element is not supposed to be used then select Undefined. • Null: Denotes the Null data type for the data element. • Custom Value: Denotes the static value for the Data Element.
Step 3.2.1: Redaction
Select the Redaction option for the data element if it contains sensitive information. When redaction is enabled and a strategy is applied, the backend server will scramble or mask the data when it is used in a tag or provider to maintain privacy.
Data Classification:
Under the Redaction section, click the Data Classification dropdown and choose the appropriate classification type based on the data element. The available options are:
Not Applicable – No redaction strategy is applied.
Email – Digits in the email are scrambled.
IP Address – The last octets of the IP address are zeroed out.
Phone Number – The first 3 digits are retained; the remaining digits are set to 0.
Date – The month and year are kept; the date is set to 1.
Step 3.3: Custom JavaScript
In this field, you can enter a custom JavaScript function to define advanced logic or processing for the data element. Ensure the code is valid and tested before saving.
Step 3.3.1: Is Async Function? (Checkbox): Check this box if the custom JavaScript function is asynchronous. Enabling this allows the system to correctly handle promises returned by the function.
Step 3.4: Ingest Labs Data Layer
Under the Ingest Labs Data Layer section, configure the following fields:
Step 3.4.1: Element Name:
Enter the name of the data element.
Step 3.4.2: Default Value:
Specify a default value for the element, used when no value is received from the data layer. The same storage options apply here as in the previous section:
EVENT – Data is stored only for the duration of the event.
NONE – Data is not stored.
SESSION – Data is retained for the user session.
VISITOR – Data is retained across multiple sessions for the same visitor.
Note: Transformation Function, Redaction, and Storage Duration fields follow the same steps as described above.
Step 3.5: Click Save to save the changes.
You can adjust the number of Tags displayed per page using the dropdown menu located at the top-right corner of the screen.
50 per page: Displays up to 50 Tags on the current page.
100 per page: Displays up to 100 Tags on the current page.
200 per page: Displays up to 200 Tags on the current page.
The Refresh button allows you to reload the Tags screen. If you create new Tags or update their properties and the changes are not immediately visible on the main UI screen, clicking the Refresh button will reload the page to display the most up-to-date information.
When you click on the three-dot menu (⋯), the following options are displayed:
Clone: This option allows you to create a duplicate of the selected Tag. When you click Clone, a new Tag is created with the same properties as the original, which you can then modify as needed. It's useful for quickly setting up similar Tags without re-entering all the details.
Delete: This option permanently removes the selected Tag from the system.
Filter the tags based on the following types:
Filter By Name: Filters tags based on their names.
Filter By Attribute Value: Filters tags based on their attribute values.
Filter By Metadata Attribute: Filters tags based on their metadata attributes.
All Provider Types: Displays a list of all available provider types.
Image Tags: Displays a list of image-based tags.
JS Tags: Displays a list of JavaScript-based tags.
The Tag Status defines whether a tag is currently active (Enabled) or inactive (Disabled).
Enabled
The tag is active and available for use.
Select Enable from the drop-down menu.
The list of enabled tags is displayed.
Disabled: The tag is inactive and hidden from active use. Instead of deleting a tag when it is not needed, you can disable it and re-enable it later if required.
Select Disable from the drop-down men.
The list of disabled tags is displayed.
The Filter By Providers option filters the tags based on the providers.
Click Filter by Providers.
The Choose Providers panel opens on the right.
Select a provider from the list or use the search bar to find one.
Note: You can select one or multiple providers.
Click Done.
Step Result: All the tags associated with the Provider Name appear on the screen.
The Filter by Qualification Criteria option allows you to filter tags based on a predefined qualification criteria list.
Click on Filter by Qualification Criteria.
The Choose Qualification Criteria dialog box appears on the right side of the screen.
Select the applicable qualification criteria from the list.
Alternatively, enter the name of the criteria in the Filter by Name field to search for a specific criterion.
Click Done to apply the filter.
Step Result: Click a tag. Under Qualification Criteria, the selected qualification criteria is displayed.
This option allows you to filter tags based on specific trigger conditions.
Click on Filter by Triggers.
The Choose Triggers panel opens on the right side of the screen.
Select one or multiple triggers from the list, or use the search bar to find specific triggers.
Click Done to apply the filter.
To view the selected trigger(s), click on the tag. the associated triggers will be displayed under the Triggers section.
The Filter by Data Elements option allows you to filter tags based on predefined Data Elements.
Click on Filter by Data Elements.
The Choose Data Elements dialog box appears.
Select one of the following options:
Default Data Elements
User-Defined Data Elements
Enter the name of the Data Element in the 'Filter by Name' field to search for a specific element. You can either type the name or select it from the list.
Click Done to apply the filter.
Step Result: All the tags associated with the Data Elements appear on the screen.
The Reset Filters option resets the applied filter settings.
Name
Denotes the Tag Name.
Support
Denotes whether the tag is a server-side or a browser-side setting.
Status
Denotes the tag status: • Production: Displays the tags in the production stage. • Staging: Displays the tags in the Staging process. • Pending Publish: Displays the tags yet to be published. • Published: Displays the published tags. • Deleted: Displays the deleted tags.
Provider
Denotes the Provider name and the format. • IMG: Denotes the Provider in the Image format. • JS: Denotes the Provider in the Java Script format.
Validity Period
Denotes the validity period of the tag configured while creating the tag.
Updated By
Specifies the user who updated the tag.

Follow these instructions to successfully set up a new provider:
Step 1: Click Add Cookie Provider.
Step 2: Enter Provider Details.
Name: Input an appropriate and descriptive name for the Cookie Consent Provider.
Description: Provide a clear and relevant description that outlines the purpose of the provider.
Step 3: Select Consent Template.
Choose between the two available consent templates:
One Trust Consent Provider: This is a third-party solution for managing cookie consent. It's an external service that integrates into your system to handle user consent preferences automatically.
Custom Template: This allows you to design and configure your own cookie consent setup according to your specific requirements.
Step 3.1: One Trust Consent Provider:
Follow these steps to set up a Cookie Consent Provider with the One Trust Consent Provider template:
When you choose the One Trust Consent Provider template, you won’t need to write JavaScript code, as it's a third-party solution that automatically manages cookie consent for you.
Name: Click the Name field and enter a unique and descriptive name for the provider.
Description: Click the Description field and provide a brief explanation of what the provider does.
After filling in the necessary details, click Save to finalize the setup.
Step 3.2: Follow these steps to set up a Cookie Consent Provider with the Custom Template:
Name: Click the Name field and provide a unique name for the provider.
Description: Click the Description field and enter a brief explanation of the provider's purpose.
JavaScript: In the JavaScript field, paste the relevant custom JavaScript code that handles the cookie consent functionality.
After filling in the necessary details, click Save to finalize the setup.
Assigning Classification Codes
Cookie classifications help you organize and manage cookies based on their purpose and functionality.
Assigning appropriate classifications ensures compliance with regulations and provides clarity for users about how their data is being used.
Common Cookie Consent Classification Codes:
· Strictly Necessary Cookies: Cookies that are essential for the website to function: C0001
· Preference Cookies: Cookies that remember user preferences or choices: C0002
· Performance Cookies: Cookies that collect information about website usage: C0003
· Targeting/Advertising Cookies: Cookies used to deliver personalized ads, track browsing behaviour, and build user profiles for targeted advertising: C0004
· Functional Cookies: Cookies that provide additional functionality, such as remembering login credentials or enabling live chat: C0006
·Session Cookies: Temporary cookies used for maintaining a session across pages: C0007
· Persistent Cookies: Cookies that stay on the user's device after the session ends, typically used for remembering login details or user preferences between sessions: C0008
· First-party Cookies: Cookies set by the website the user is currently visiting: C0009
· Third-party Cookies: Cookies set by external sites, usually for advertising, tracking: C0010
Ste 1: On the left-hand menu under Data Governance, click Cookie Classifications to access the classification settings.
Step 2: Click the Add Cookie Classification button located at the top right.
Step 3: Classification Code: Add an appropriate code to identify the classification.
Step 4: Classification Name: Add a descriptive name for the classification.
Step 5: Description: Provide a brief explanation outlining the purpose of the classification.
Step 6: Under Cookie Providers, click Add Provider to add the appropriate provider.
Step 7: In the Consent Code, give the appropriate consent code. Click Provider and select the appropriate cookie provider.
List of consent codes are:
· Consent Given: The user has consented to the use of strictly necessary cookie: C0001-allow
· Consent Denied: The user has denied consent for strictly necessary cookies: C0001-deny
· Full Consent: The user has granted consent for all cookie categories: C0000-all-allow
· Partial Consent: The user has given consent for some cookie categories (e.g., accepting necessary and performance cookies, but rejecting advertising cookies) C0000-partial-allow
· No Consent Given: The user has not given consent for any cookies, meaning no cookies (except strictly necessary) should be set: C0000-no-consent
Step 8: Once all details are entered, click Save
A confirmation message will appear: Cookie Classification was created successfully.
Step 9: The status will be marked as Pending Publish. To finalize, you must publish the classification.
Publish the Cookie Classification
Step 1: On the left-hand menu click Publish.
Step 2: Click Publish to Staging.
Step 3: Scroll down to the Classification Codes section and check the appropriate cookie classification. Once selected, the related Cookie Provider will appear automatically.
Ste 4: Scroll up and click Review.
Step 5: In the Name section, provide an appropriate name. In the Description section, enter a relevant description, and then click Publish to Staging.
Step 6: A popup message will appear, confirming the publication with the message: Published item successfully. This confirms that the item has been published.
Step 1: In the left-hand menu, go to the Providers section.
Step2: Click the particular Cookie Classification, then click the Action button dropdown and select Edit.
Step 3: Scroll down to the Classification Codes (Optional) section and click Add Classification Codes.
Step 4: The Classification Codes panel will open on the right side. You can either search for a code in the search bar or create a new one by clicking Create Consent Classification.
Step 5: Click Save
A popup message will appear: Provider was updated successfully, confirming the update.
Restoring a Deleted Cookie Consent Provider
Note 1: Both Cookie Consent Providers and Cookie Classifications have a restore option, allowing you to recover deleted items if needed.
Note 2: The restore option for both Cookie Consent Providers and Cookie Classifications is available only if they have been published.
Note 3: To delete a Cookie Classification, it must not have any dependencies. If dependencies exist, they must be removed before the classification can be deleted.
Click Restore.
A confirmation pop-up message will appear, confirming that the Cookie Classification has been restored successfully.
Step 1: From the left navigation panel, select Providers.
Step 2: Select Add Provider -> For Browser on the top-right corner of the screen.
Step 3: The Provider Template panel opens on the right side and choose a template from the list or use the Search bar to find a specific one.
Note: In the list, each template includes a label such as IMG, JS, or APP, indicating whether the provider uses an image-based, JavaScript-based, or app-based implementation.
Step 4: Let us take an example of the Facebook JS provider template.
Step 5: Under Provider Details, the Name and Description fields will already be filled in.
Step 6: The Script section includes both the Template script and Provider script.
You can enter the JavaScript in the Provider Script section and click Save to save the changes.
Step 7: The Attributes section lists the Attributes for Data Elements and Transformers. This is an Optional section.
Step 7.1: Click Choose Data Element.
Step 7.1.1: The Select Data Element panel opens on the right side of the screen.
At the top of this panel, you’ll find a Search Bar.
You can either:
Use the search bar to find a specific Data Element, or
Choose from the list displayed under the two tabs:
User-Defined
Default
Step Result: The selected Data Element is visible in the Value section.
Note: To cancel the selected Data Element, click the small x icon next to the selected item.
Step 7.1.2: Attribute Settings
Under the Settings section, you can configure the following options for each attribute:
Mandatory: Select this checkbox to make the value mandatory.
Fatal: Select this checkbox to stop the process if the value is missing or invalid.
Ignore If Empty: Select this checkbox to skip this value during processing if it is not set.
Hash (SHA256): Select this checkbox to securely convert the value into a SHA256 hash before processing.
Step 7.1.3: Settings
Click the Settings option, the Attribute Settings window opens.
Note: All the attributes selected earlier will already be checked. If you want to make changes, you can update them here.
Under Transformers, you will find the URL Encode checkbox. Check this box if you want the value to be automatically encoded for safe transmission in a URL.
Step 7.1.4:Data Type Conversion
Click the Data Type Conversion drop-down.
The following options are available:
No Conversion: Indicates that there is no conversion required for the data type.
Convert to Boolean: Converts the input data to Boolean.
Convert to Number: Converts the input data to a number.
Convert to Array: Converts the input data to Array.
Convert to Object Spread: Converts the JSON attributes under a parent level attribute to the root level attributes.
Step 7.2: Click Choose Transformer.
Step 7.2.1: The Select Transformer panel opens on the right side of the screen.
At the top of the panel, there is a Search Bar. You can either:
Use the search bar to quickly find a Transformer, or
Browse through the list displayed below and select a Transformer manually.
Step Result: The selected Transformer is visible in the Value section.
Note: To cancel the selected Transformer, click the small x icon next to the selected item.
Step 7.2.2: Attribute Settings
Under the Settings section, you can configure the following options for each attribute:
Mandatory: Select this checkbox to make the value mandatory.
Fatal: Select this checkbox to stop the process if the value is missing or invalid.
Ignore If Empty: Select this checkbox to skip this value during processing if it is not set.
Hash (SHA256): Select this checkbox to securely convert the value into a SHA256 hash before processing.
Step 7.2.3: Settings
Click the Settings option, the Attribute Settings window opens.
Note: All the attributes selected earlier will already be checked. If you want to make changes, you can update them here.
Under Transformers, you will find the URL Encode checkbox. Check this box if you want the value to be automatically encoded for safe transmission in a URL.
Step 7.2.4: Data Type Conversion
Click the Data Type Conversion drop-down.
The following options are available:
No Conversion: Indicates that there is no conversion required for the data type.
Convert to Boolean: Converts the input data to Boolean.
Convert to Number: Converts the input data to a number.
Convert to Array: Converts the input data to Array.
Convert to Object Spread: Converts the JSON attributes under a parent level attribute to the root level attributes.
Step 8: Click Save on the top right to save the new Provider (Browser).
Note: The page displays the following success message.
Add Tag
You can create the tag using this option from the Qualification Criteria.


No Conversion
Indicates that there is no conversion required for the data type.
Convert to Boolean
Converts the input data to Boolean.
Convert to Number
Converts the input data to Number.
Convert to Array
Converts the input data to Array.
Convert to Object Spread
Converts the JSON attributes under a parent level attribute to the root level attributes.
URL encode
Converts the URL in the encrypted format.
HASH (SHA256)
The value is converted to HASH (SHA256) format.
Ignore if empty
May be ignored if the value is empty.


No Conversion
Indicates that there is no conversion required for the data type.
Convert to Boolean
Converts the input data to Boolean.
Convert to Number
Converts the input data to Number.
Convert to Array
Converts the input data to Array.
Convert to Object Spread
Converts the JSON attributes under a parent level attribute to the root level attributes.
URL encode
Converts the URL into the encrypted format.
HASH (SHA256)
The value is converted to HASH (SHA256) format.
Ignore if empty
May be ignored if the value is empty.


Returning Users
Registered and unregistered users who repeatedly access the website
First visits by Users
First visits by registered and unregistered users
Sales through Campaigns
Total sales through various ad campaigns on Google, Meta, Instagram, Wishlink, Bing, Criteo, YouTube, and others.
Sales through Direct Visits
Total sales registered through direct visits (without referral campaigns)
Top 10 Product conversion
List of products purchased, number of people purchasing the products, total value of the purchase
This section explains the different tabs available on the Ingest Labs UI screen.
After signing in, the landing page appears, displaying the Vendor Name at the top and the Username along with the Email ID of the signed-in customer at the bottom left.
Click the User Icon to edit the profile or log out of the application.
The Products section includes the list of products available for a particular Ingest Labs project.
A Notification Group allows you to add multiple email addresses to receive alerts for alarms and product updates. Notifications are set at the client level, ensuring that only the relevant people receive alerts at the right time.
The Info section displays the information related to the product.
The Users section displays the number of users accessing the Ingest Labs product and the roles allocated for a particular user.
To add a new user, perform the following steps:
Click Users.
Click Add User on the top-right corner of the screen.
Enter the e-mail in the E-mail field.
Enter the Full Name in the Full Name field.
Enter the Last name in the Last Name field.
Note: Provide email ID, first name and last name to add a user. If any field is left blank, the screen displays a warning.
Step Result: Once you add a user, the user receives an e-mail notification to activate the account.
Note: If the user cannot activate and reset the password, the admin may select the Re-invite User option to trigger the e-mail notification again.
You can delete a user using the delete icon to the right of the user.
To delete a user, perform the following steps:
Navigate to Users section.
Select the user and click the three dots to the right of the user.
Click Delete.
Click Yes on the confirmatory message.
You will receive a success message after the user is deleted.
Delete the user cache using the clear cache option to the right of the user. User roles are cached for a short duration on the backend server to facilitate Role-Based Access Control (RBAC). When a user's role changes, delete the user's roles and permissions from the cache using the Clear Cache feature. This ensures that the updated roles and permissions take effect immediately.
To clear the cache of a particular user, perform the following steps:
Navigate to Users section.
Select the user and click the three dots to the right of the user.
Click Clear Cache.
The Roles section displays the multiple roles assigned to the particular user.
Following are the steps to assign the roles to the user:
Using Users Section
Navigate to the Users section on the top.
Select the respective user and click Edit.
Select the roles for the user from the drop-down list.
Click Save.
Note: You will receive an e-mail notification for any edits or modifications.
Using the Roles Section
Navigate to the Roles section on the top.
Select the role to edit.
Under the List of Users associated with this role, enter the user's e-mail ID.
You can delete the roles using the Delete icon at the right-hand corner of the screen.
To delete the roles in the User section, perform the following steps:
Navigate to Users section.
Select the user and click Edit on the top right corner of the screen.
You must clear the roles of a particular user and click Save.
The Usage option includes the real-time metrics and the data collected based on the number of days. By default, the data for the last seven days appears. However, you can modify the number of days to view the metrics for a particular category.
To view the usage details, select Product -> Project -> Category.
Note: The Projects option is available only in Tag Manager. By default, All Projects is selected under Products tab.
If there is no data available, then the following message appears: “Metrics data is currently unavailable.”
The following are the default user options:
You can view the following details with the usage in each category:
The same categories are listed under the All Categories drop-down for a detailed view of the metrics. For example, to view the Collector API calls from the previous week, click Collector API Calls from the All Categories drop-down and select Last One Week. To view the graphical representation for the last month, select Last One Month and click Refresh.
The Notifications option displays the notifications triggered for a particular user. You can add any number of e-mail IDs for a Notification Group. The Notifications are triggered at the client level for alarms and other products.
Note: While creating alarms, you can set a notification group e-mail for each alarm. The two types of alarms that are triggered under Tag Manager are: • Tag Anomaly Detection Alarm • Tag Expiration Alarm
To add a new notification group, perform the following steps:
Click Add Notification Group on the top-right corner of the screen.
In the Info screen, add the Name in the Name field.
Enter the Description.
Enter the e-mail ID in the Add New User field under the Destinations section.
Click Save.
Step Result: The new notification is added.
The Integrations section describes the third-party integrations using the Authorization token. You can set the token expiry to 1 hour, 12 hours, and 72 hours accordingly.
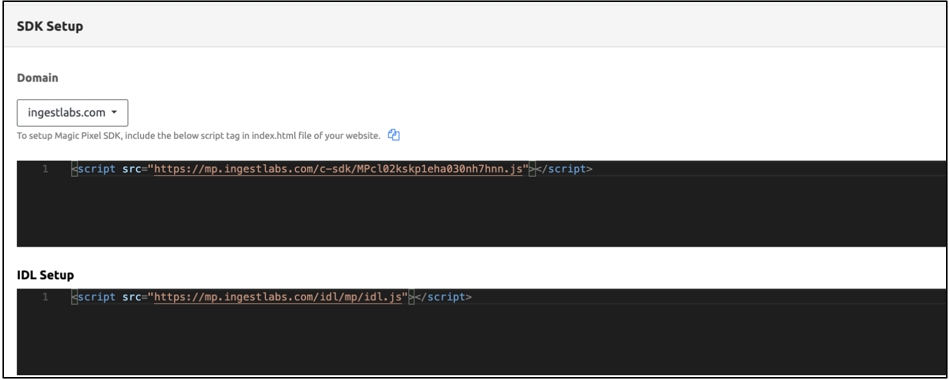
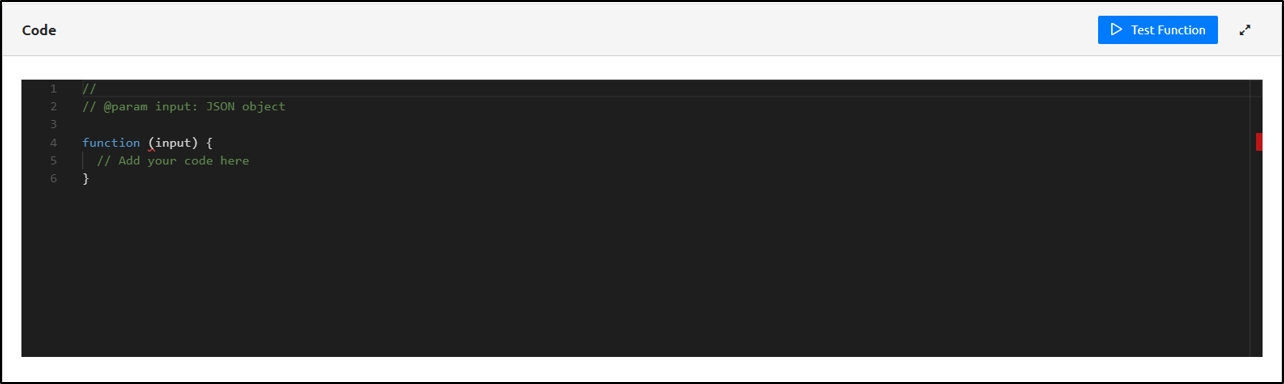
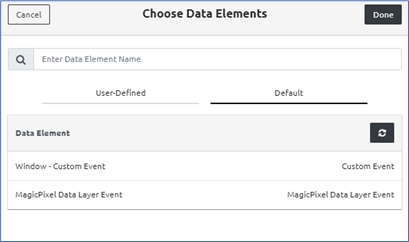
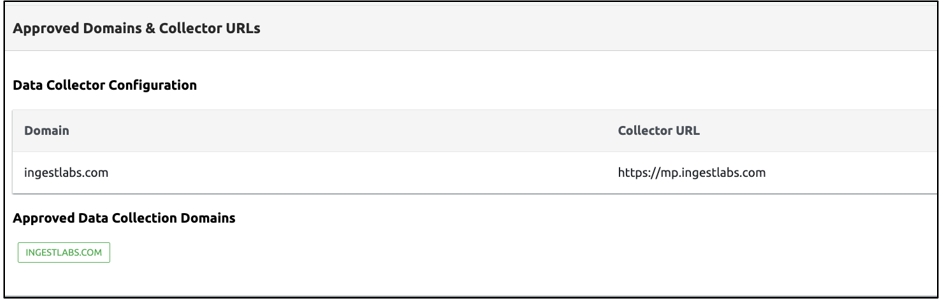

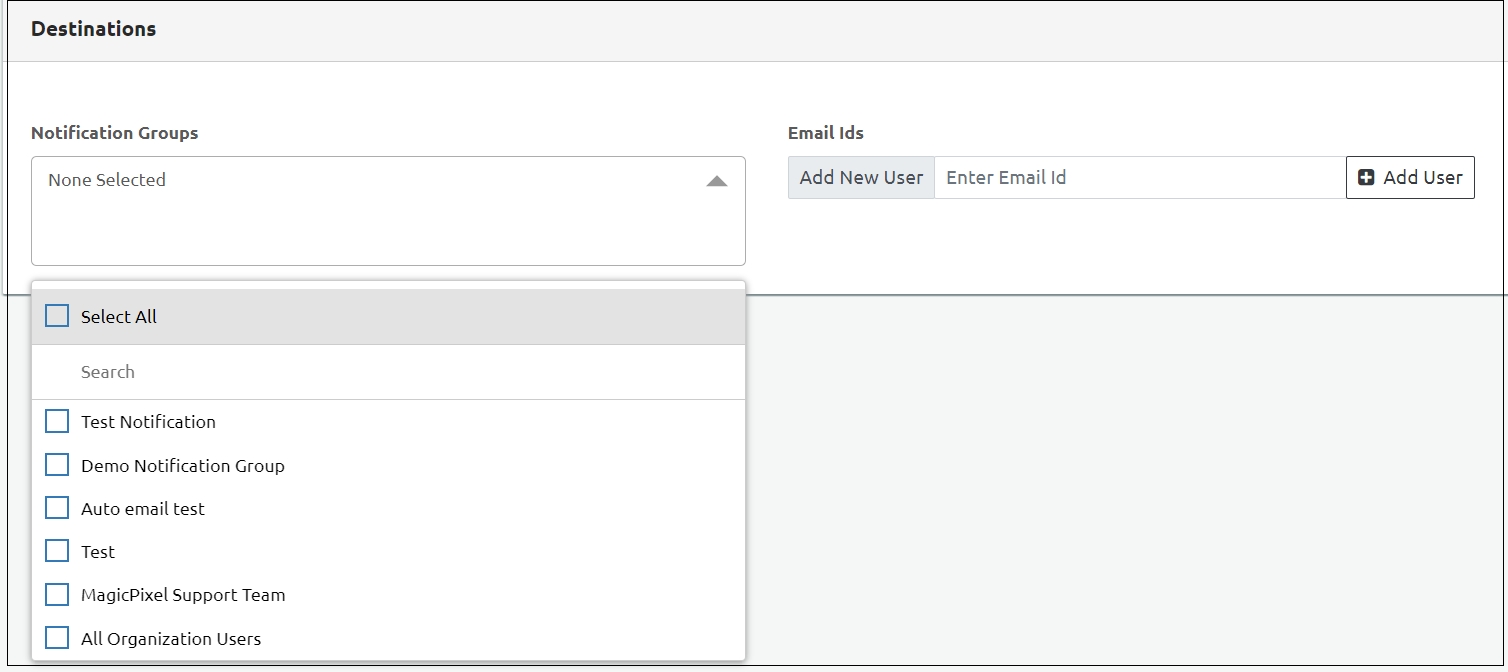
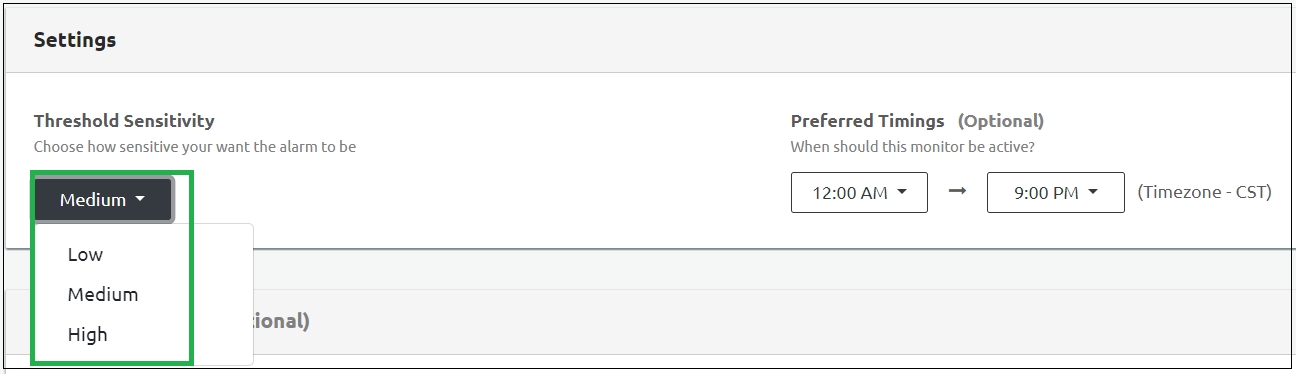
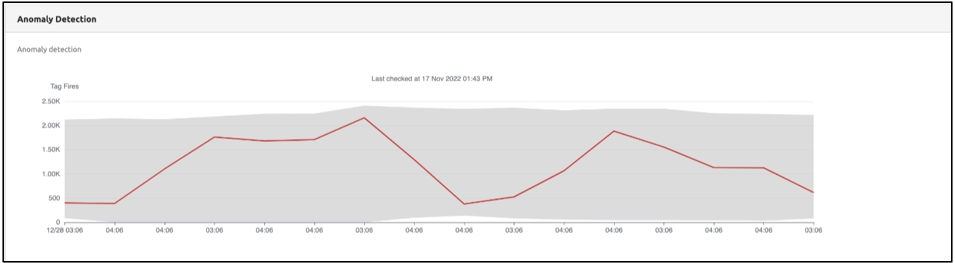

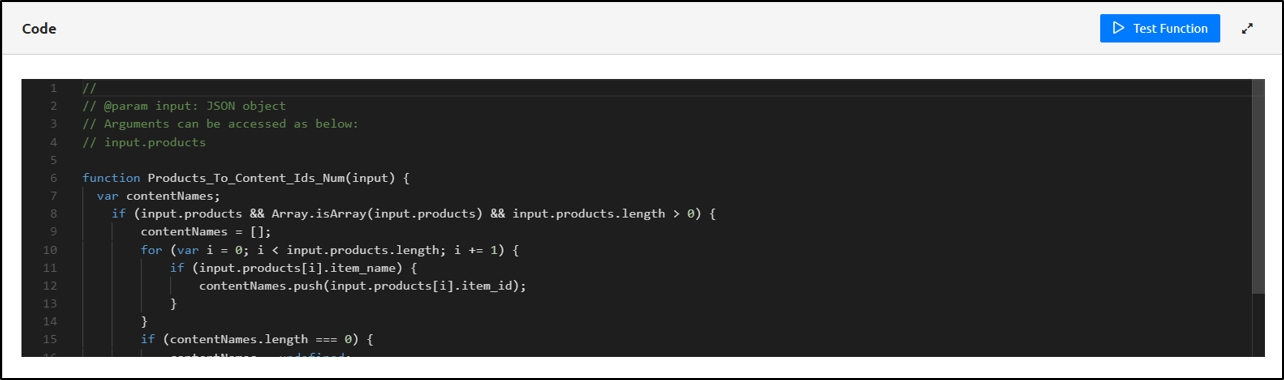


Step 1: Click Add Provider and select Server from the options available at the top-right corner of the screen.
Step 2: The Provider Template panel appears on the right side of the screen. Select a template from the available list, or use the Search bar to quickly find a specific template.
Step 3: Let's take an example of the Facebook Conversion API provider template.
Note: In the list, each template includes a label such as IMG, JS, or APP, indicating whether the provider uses an image-based, JavaScript-based, or app-based implementation.
Step 4: The Provider Details section is automatically pre-filled based on the selected provider. However, you can make changes if needed by editing the available fields.
Step 5: In the Attributes section, you can view the attributes for Data Elements and Transformers.
Step 5.1: Click Choose Data Element to select the relevant data element for the attribute.
Step 5.1.1: The Select Data Element panel opens on the right side of the screen. At the top of this panel, you will see a Search bar.
You can do one of the following:
Use the Search bar to find a specific data element, or
Browse and select from the list displayed under the two tabs:
User-Defined
Default
Step Result: The selected Data Element is visible in the Value section.
Note: To cancel the selected Data Element, click the small x icon next to the selected item.
Step 5.1.2: Settings Configuration:
Under the Settings section, the following checkboxes are available:
Mandatory: Ensures the attribute must be set.
Fatal: Terminates the process if the value is missing or invalid.
Ignore If Empty: Skips the attribute during processing if no value is provided.
Hash (SHA256): Converts the value into a secure SHA256 hash.
Step 5.1.3: Click Settings to configure these options.
Step 5.1.4: The Attribute Settings window opens.
Note:
All previously selected attributes will appear ticked.
You can uncheck any previously selected items or check the boxes for new attributes as needed.
Step 5.1.5: Under the Transformers section:
URL Encode: Check this box if you want the value to be automatically encoded for safe URL transmission.
Step 5.1.6: Click the Data Type Conversion drop-down. The following options are available:
No Conversion: No change will be applied to the data.
Convert to Boolean: Changes the data to true or false.
Convert to Number: Converts the input into a numeric value.
Convert to Array: Transforms the data into an array format.
Convert to Object Spread: Moves JSON attributes from a nested level to the root level.
Step 5.1.7: Redaction Options
In the Redaction section, two checkboxes are available:
Ignore Redaction: Skips applying redaction rules for this attribute.
Exclude from Request Body: Prevents this attribute from being included in the outgoing request payload.
Step 5.1.8: Once all the required fields are filled:
Click Confirm to save the configuration.
Note: To discard changes, click Cancel.
Step 5.2: Click Choose Transformer.
Step 5.2.1: The Select Transformer panel opens on the right side of the screen.
At the top of the panel, there is a Search Bar. You can either:
Use the search bar to quickly find a Transformer, or
Browse through the list displayed below and select a Transformer manually.
Step Result: The selected Transformer is visible in the Value section.
Note: To cancel the selected Transformer, click the small x icon next to the selected item.
Step 5.2.2: Settings Configuration:
Under the Settings section, the following checkboxes are available:
Mandatory: Ensures the attribute must be set.
Fatal: Terminates the process if the value is missing or invalid.
Ignore If Empty: Skips the attribute during processing if no value is provided.
Hash (SHA256): Converts the value into a secure SHA256 hash.
Step 5.2.3: Click Settings to configure these options.
Step 5.2.4: The Attribute Settings window opens.
All previously selected attributes will appear ticked.
You can uncheck any previously selected items or check the boxes for new attributes as needed.
Step 5.2.5: Click the Data Type Conversion drop-down menu.
Select the appropriate conversion type from the available options:
No Conversion
Indicates that there is no conversion required for the data type.
Convert to Boolean
Converts the input data to Boolean.
Convert to Number
Converts the input data to a number.
Convert to Array
Converts the input data to Array.
Convert to Object Spread
Converts the JSON attributes under a parent level attribute to the root level attributes.
Step 5.2.6: In the Redaction section, two checkboxes are available:
Ignore Redaction: Skips applying redaction rules for this attribute.
Exclude from Request Body: Prevents this attribute from being included in the outgoing request payload.
Step 5.2.7: Once all the required fields are filled:
Click Confirm to save the configuration.
Note: To discard changes, click Cancel.
Step 6: HTTP Headers (Optional)
Step 6.1: To add HTTP headers:
Click Add Header.
In the Name field, enter the header name.
In the Value field, enter the corresponding value.
Select the Mandatory checkbox if the header is required.
Note: To delete a header, click the Delete option next to it.
Step 7: Connectors:
In the Connectors section, you will see two fields: Name and Value.
The Name field is pre-filled.
You need to enter the corresponding Value based on your configuration.
Step 8: Final Step
Once all the required fields are completed, scroll up and click Save to apply the changes.
...
The Ellipsis on the last column denotes whether to delete the tag or clone the tag. To delete a tag there must not be any dependencies. Note: You cannot delete a tag if there are any dependencies in the tag for Data Elements, Providers, Triggers, or Qualification Criteria. Only after deleting the dependent categories, you can delete the tag successfully. Even after deleting the dependencies, if you cannot delete the tag, then you must Publish the relevant categories first and then perform the delete operation. The Clone option allows you to clone the tags based on the selection of the already available providers. You can view the same settings for a particular provider and edit the required details and additional information for the new tag.


Tag Manager
In Tag Manager, SDK enables the client website to trigger API calls to Ingest Labs. In the Usage option, the Tag Manager includes metrics that are collected in real-time during the server-side API calls.
All Projects
Select a specific project to collect the metrics using the All Projects drop-down.
All Categories
Includes the following categories to collect the metrics: • Collector API Calls • Server-Side Tag Count • Server-Side Tag API Calls • Collector Bot Traffic
Collector API Calls
Denotes the number of Collector API calls from the website to Ingest Labs servers.
Server-Side Tag Count
Denotes the number of Server-side tags triggered from Ingest Labs servers.
Server-Side Tag API Calls
Denotes the number of Server-side API calls from the website to Ingest Labs servers.
Collector Bot Traffic
Denotes the number of API calls that Ingest Labs servers detect as bot traffic.


You can delete a Trigger that is no longer needed by following the steps outlined in this document.
To delete a Trigger, perform the following steps:
Step 1: Select the Trigger that you want to delete.
Step 2: From the Actions drop-down menu on the top right corner, select Delete.
Note: You cannot delete the default triggers as the option for delete option is unavailable for default triggers.
Step 3: Click Yes on the confirmatory message that appears.
Step Result: The Trigger is deleted successfully.
Media Data Platform Overview
Ingest Labs' Media Data Platform (MDP) is designed to provide deep insights into visitor behavior on websites. The MDP ensures precise tracking and analysis of visitor journeys, enabling a better understanding of user interactions. Key features include First-Party ID generation, comprehensive visitor journey tracking, and advanced cookie management, all aimed at improving data analysis, visitor insights, and website performance.
First-Party ID Generation: Generates a unique First-Party ID for each client, enabling precise tracking and tailored data analysis.
First-Party Cookie Identifier: Creates a first-party cookie identifier for each visitor to track interactions and activities.
Comprehensive Visitor Journey Tracking: Captures detailed journey information for each visitor, including pages viewed, products considered, and interaction sequences.
Identifier Generation and Management: Verifies the presence of existing Visitor IDs and generates new First-Party IDs if necessary, integrating with the Magic Pixel SDK to manage MPIDs.
Data Interpretation and Analysis: Identifies product categories viewed by visitors and generates comprehensive statistics, offering valuable insights into customer behavior.
Cookie Management and Domain Handling: Manages first-party cookies by handling sub-domains to ensure they are treated as first-party.
The Ingest Labs MDP offers enhanced visitor insights, personalized user experiences, and improved conversion rates by addressing potential drop-off points. The platform ensures accurate data tracking and collection, leading to reliable insights, and optimizes cookie management complying with privacy standards, and improving data integrity. These features collectively enhance visitor engagement and overall website performance.
Enhanced Visitor Insights: Gain a comprehensive understanding of how visitors navigate and interact with the website. This insight is crucial for optimizing user experience and increasing engagement.
Personalized User Experience: By understanding individual visitor journeys, you can tailor content and recommendations to match interests and preferences, leading to a more personalized and satisfying user experience.
Improved Conversion Rates: Detailed visitor behavior tracking allows for identifying and addressing potential drop-off points in the customer journey, enhancing overall conversion rates.
Enhanced Data Accuracy: The platform ensures accurate tracking and data collection by generating and managing unique identifiers, leading to more reliable insights.
Improved User Insights: Detailed analysis of product categories viewed and comprehensive statistics generation help understand customer preferences and behavior.
Optimized Cookie Management: Proper handling of first-party and third-party cookies ensures compliance with privacy standards and improves data integrity.


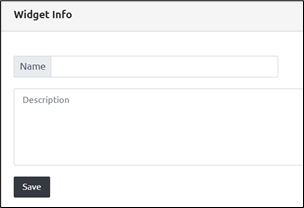
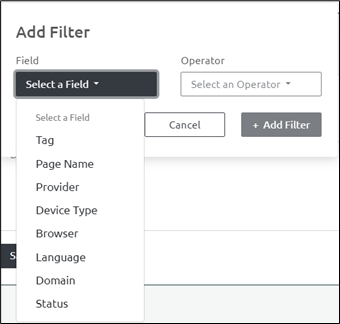
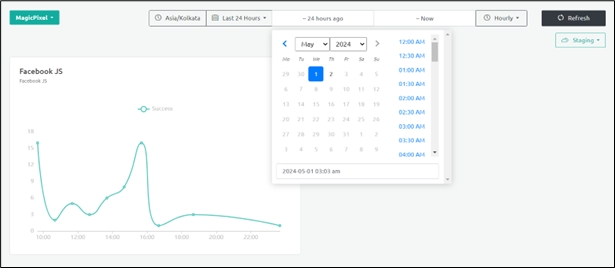
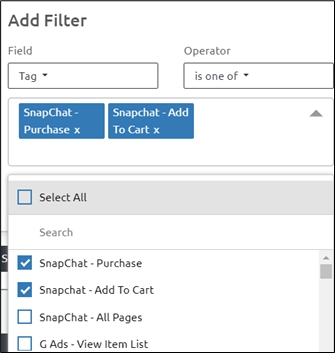


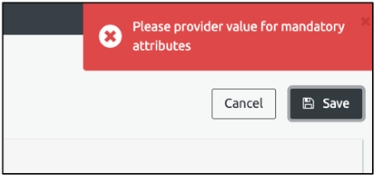
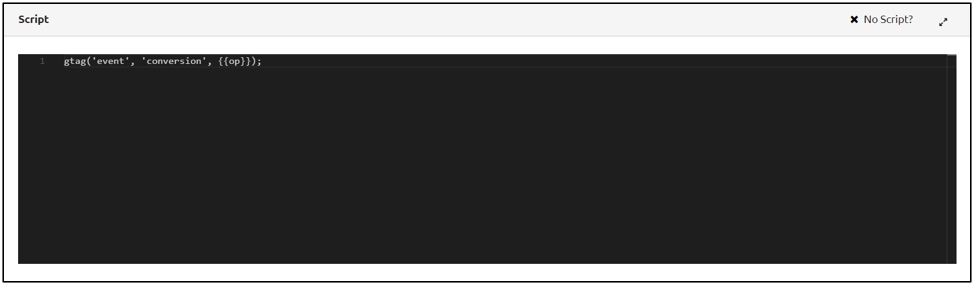
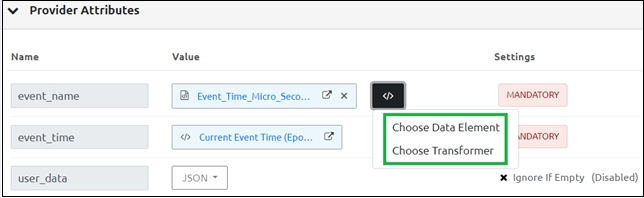


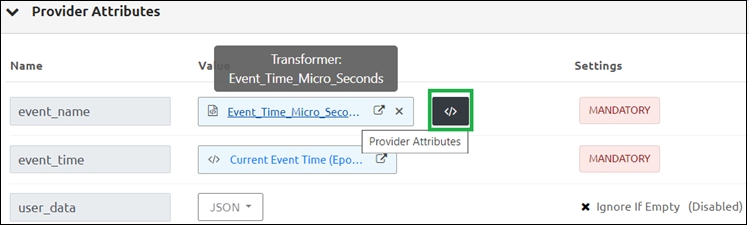
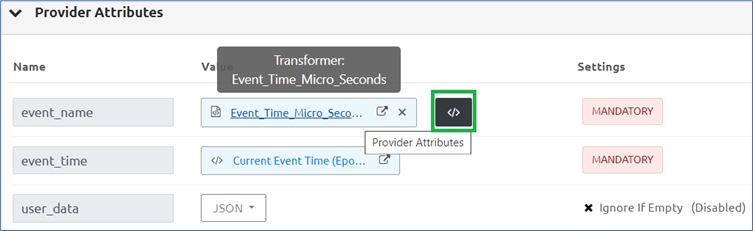
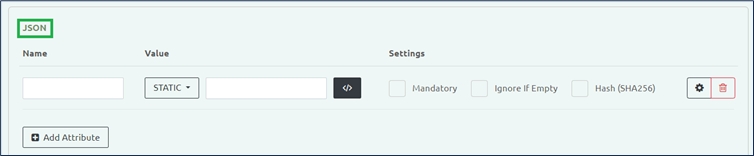
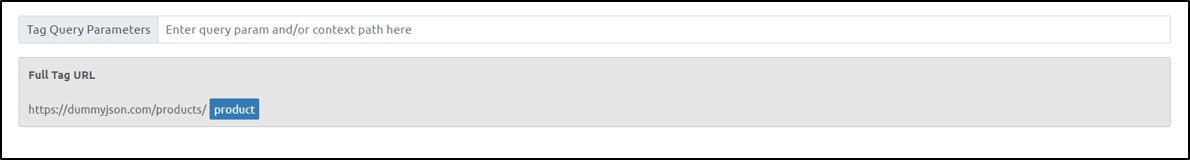
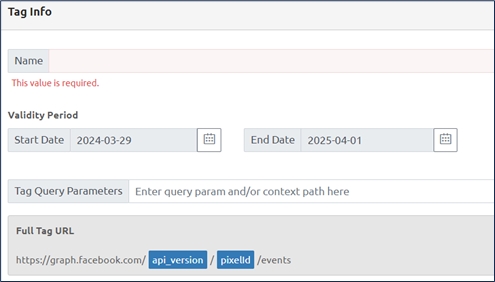
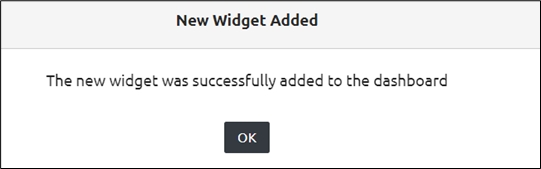
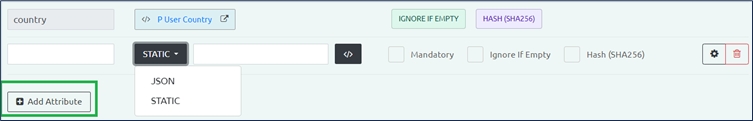
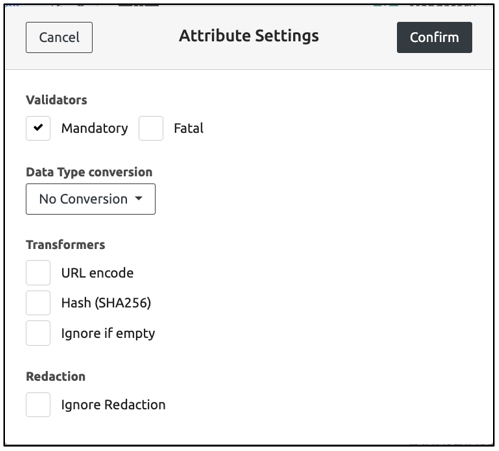
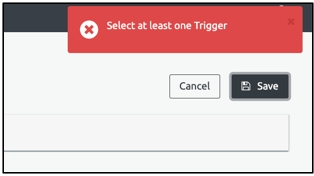
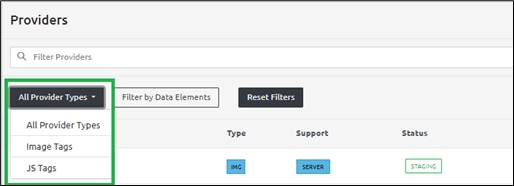
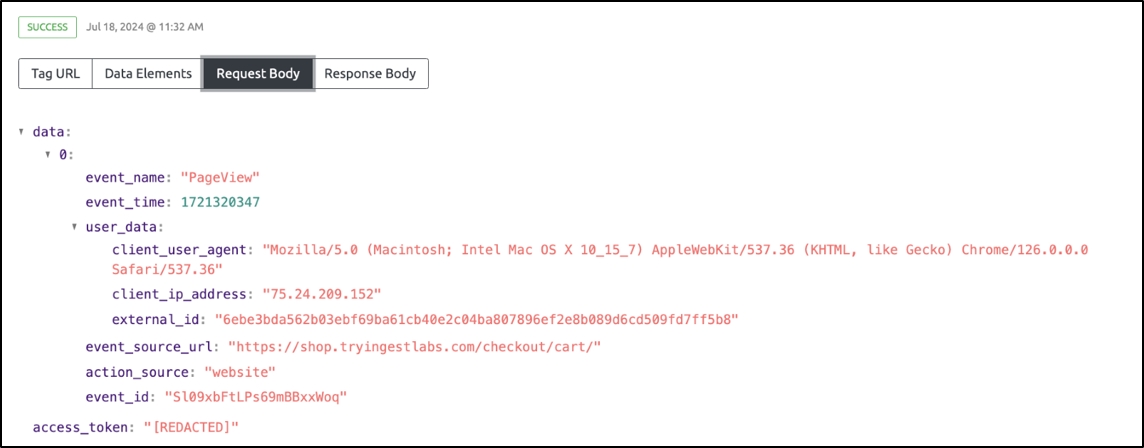
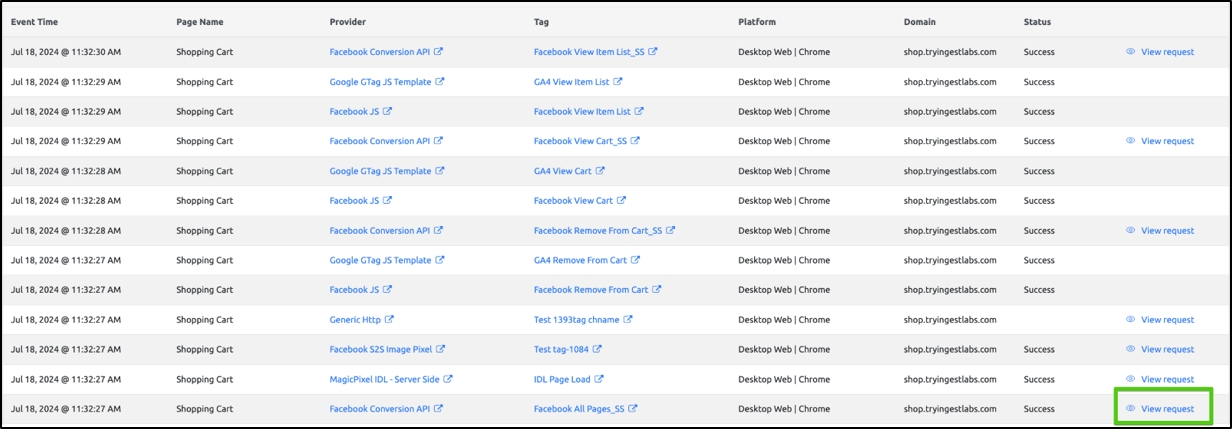
To monitor and capture events in your triggers, you can enable the recording feature. This will ensure that every event occurring within the triggers is saved and marked as recorded for future reference.
You can enable the recording feature for triggers by following these steps.
Note: You can create Record Triggers for both Server and Browser.
Step 1: Click Add Trigger.
Step 2: Click for Browser.
Step 3: Under the Info section, click the Name field and enter an appropriate name for your Record Trigger.
Step 4: Under Data Element, click Add Data Element. The Select Data Element panel will open on the right side. You can either search for a particular data element by typing its name in the search bar or select it from the available list.
Step 5: Under the Include these values section, click Add Value and enter the value you want to include. Then, click the plus symbol.
Step 6: After clicking the plus symbol, two checkboxes will appear:
Case Sensitive and
Exact Match
Click both checkboxes to apply these settings.
Step 7: Under Exclude these values, you can give values to exclude.
Under the Exclude these values, click Add Value and enter the value you want to exclude. Then, click the plus symbol.
Step 8: Under the Record Trigger section, you will find the Enable checkbox. Check the box, and then the Namespace section will appear. Provide the appropriate namespace value.
Step 9: Click Save.
Step 10: Red color indicates that the trigger is actively being recorded.
Note: The same steps apply for server-side triggers.
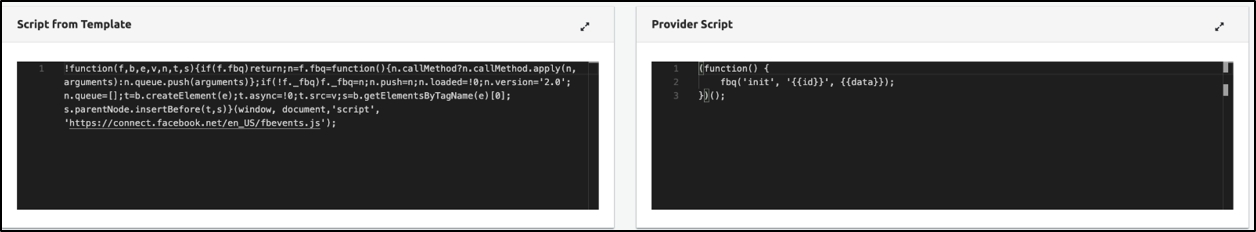
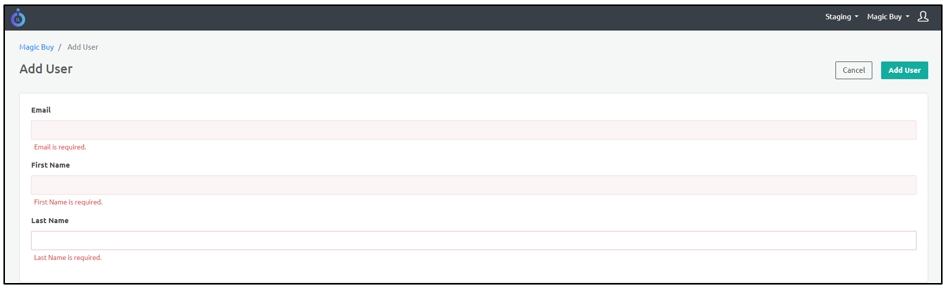


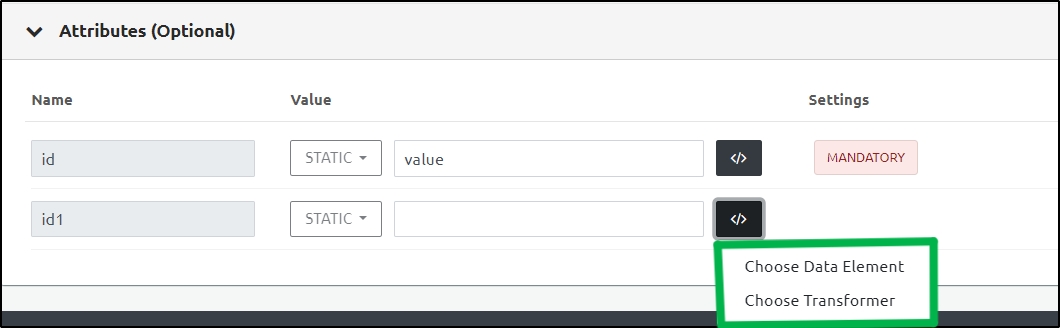
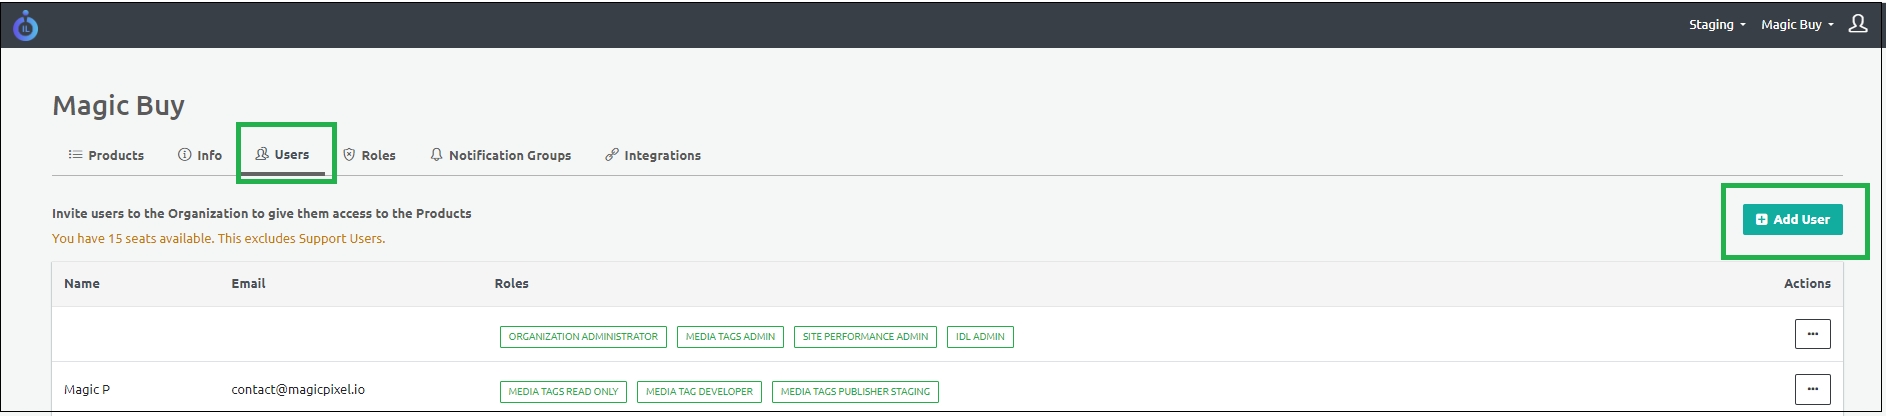
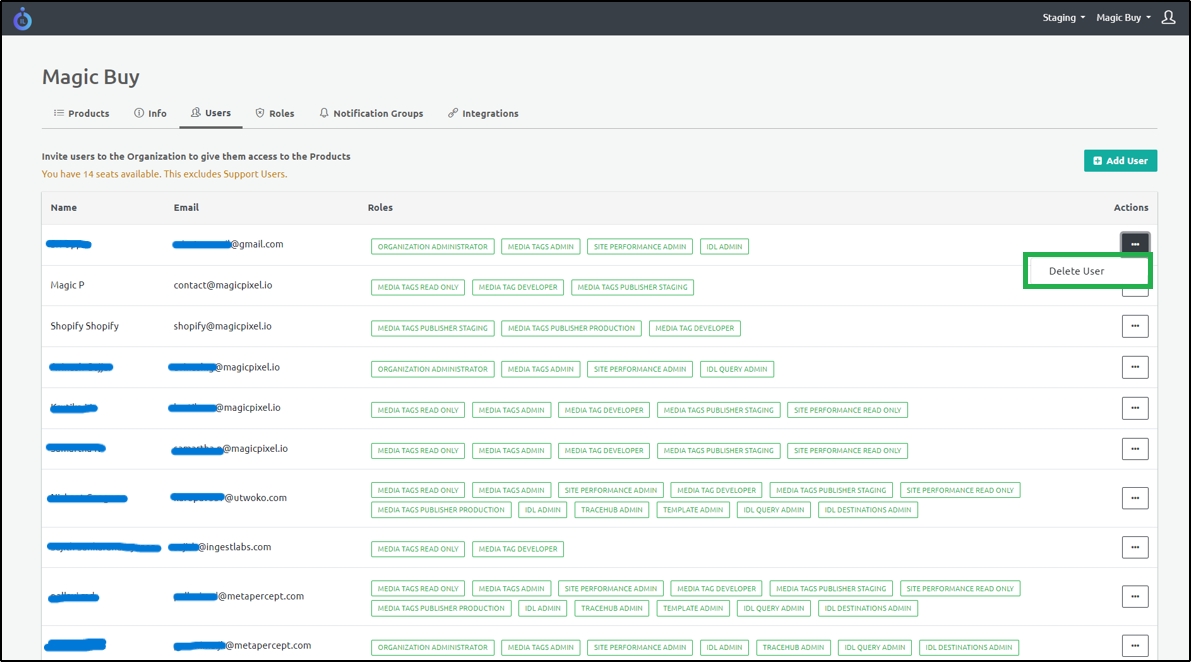

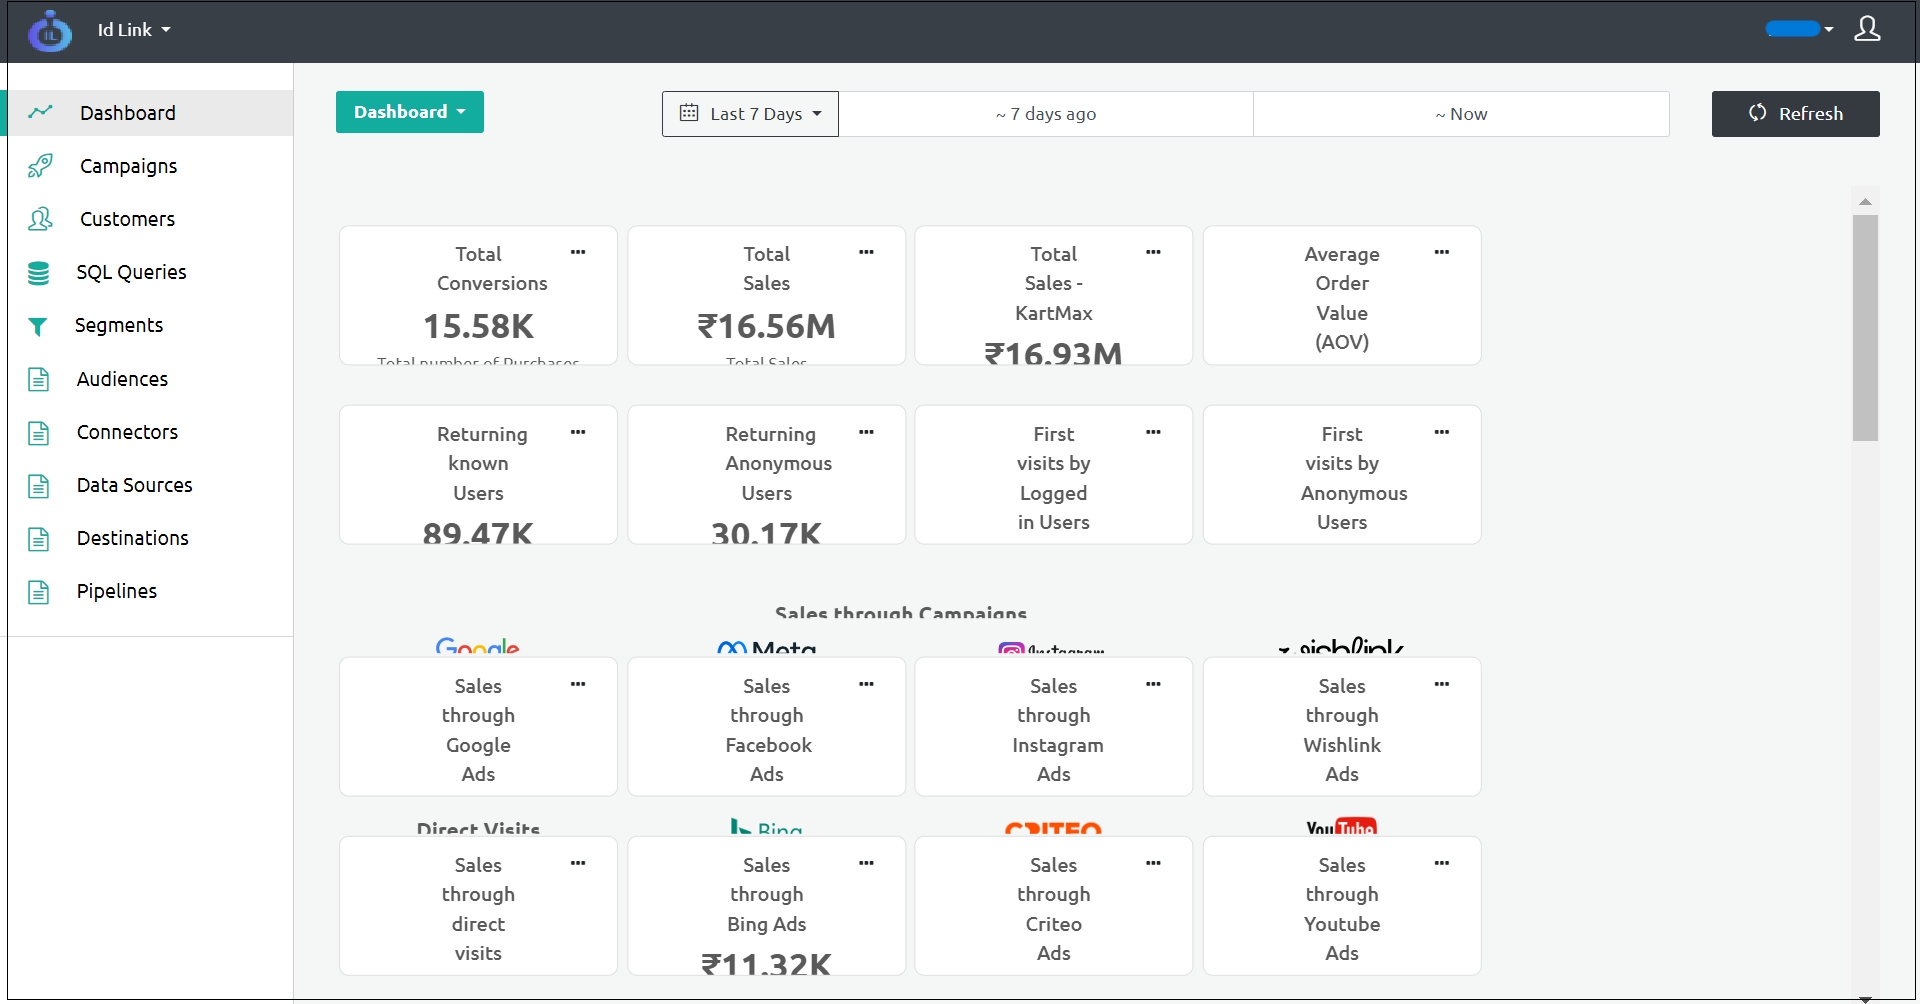
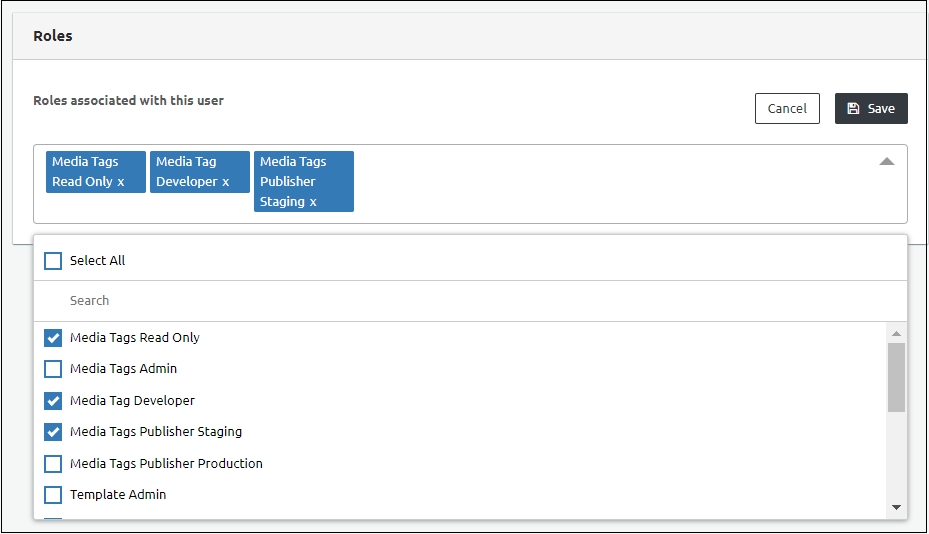
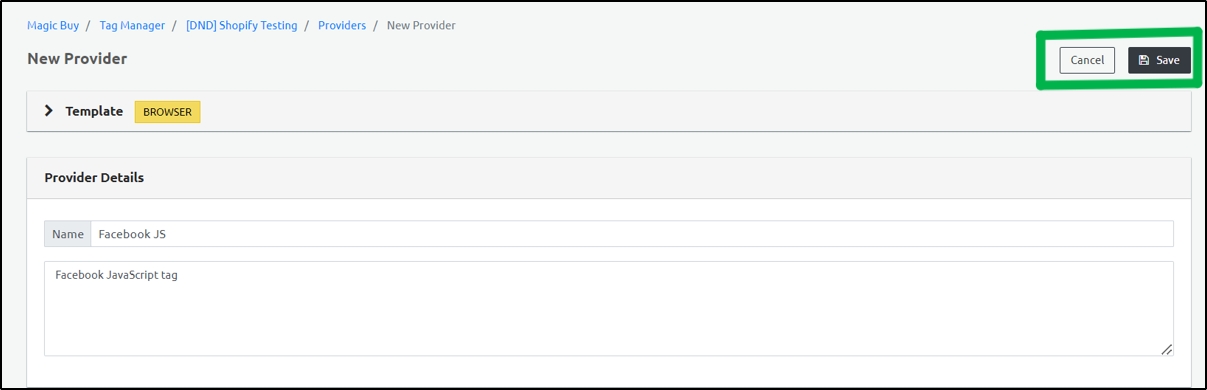
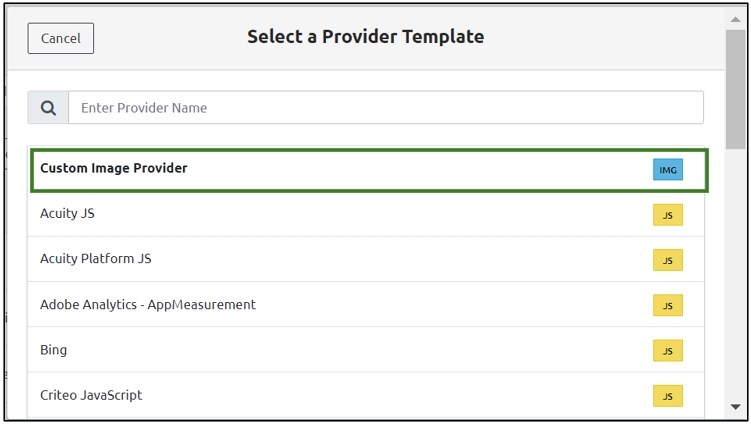
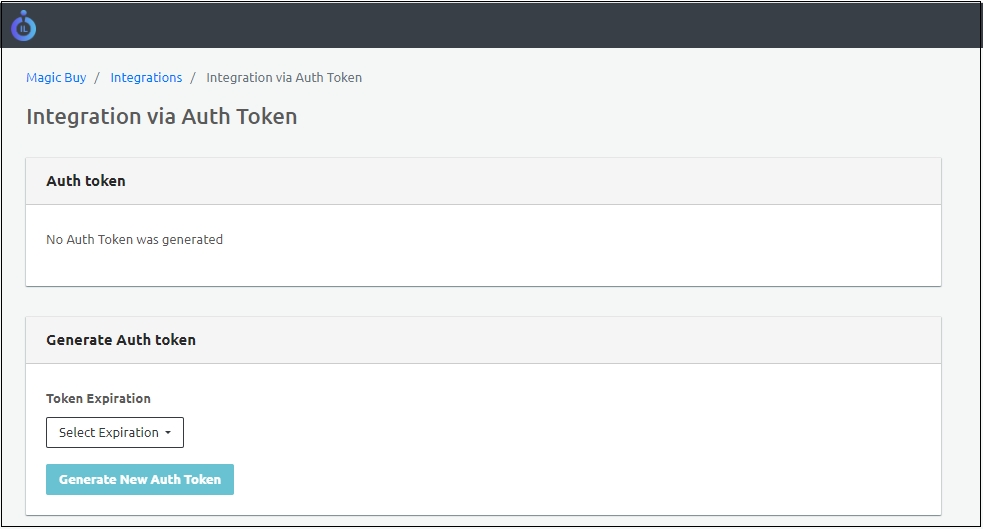
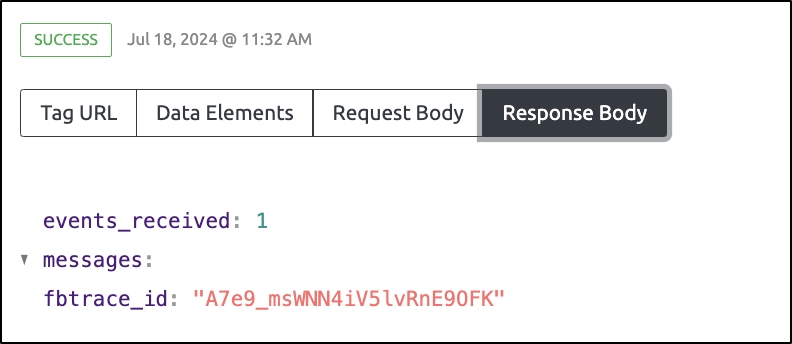
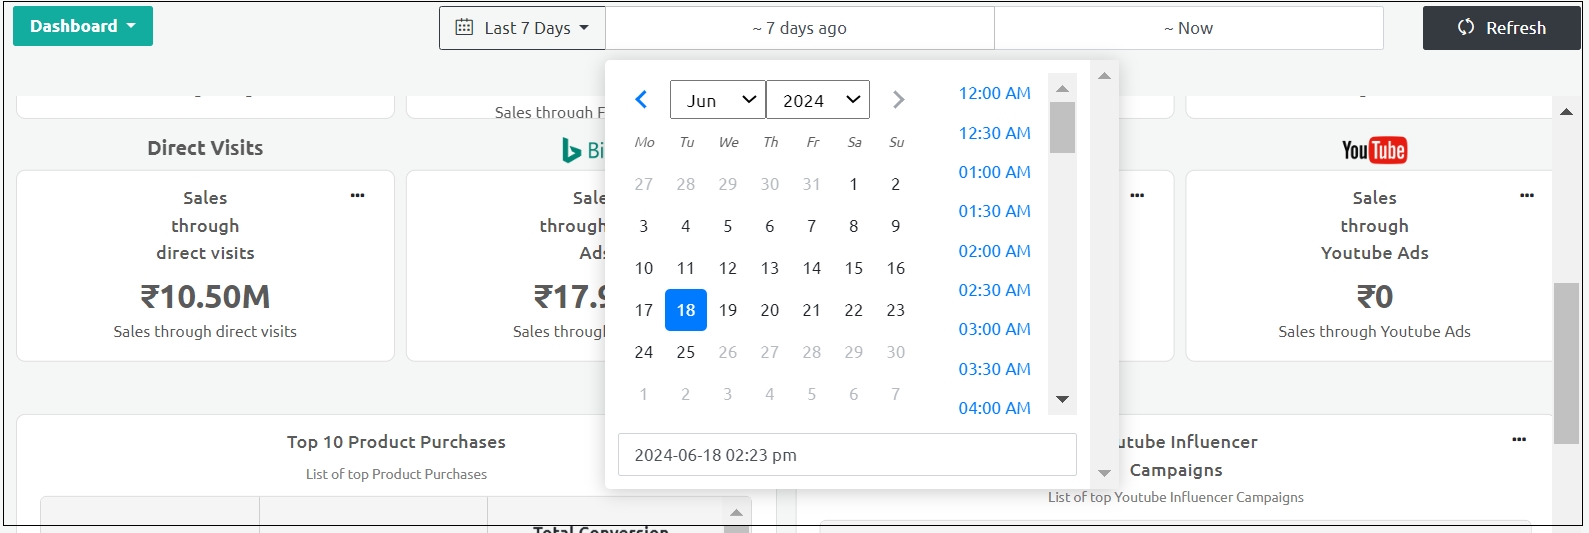
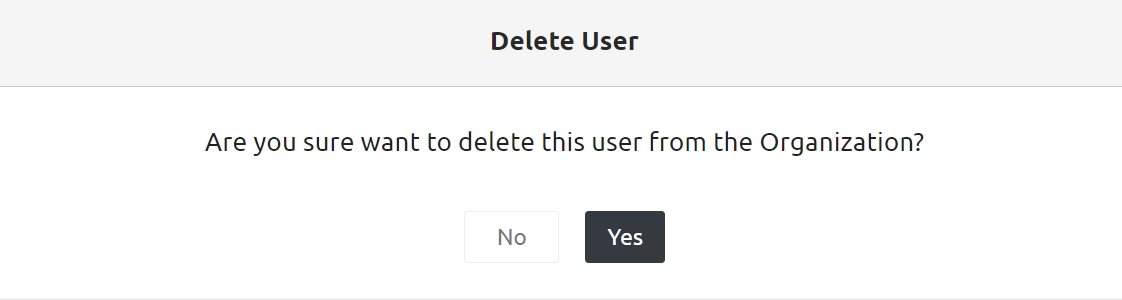
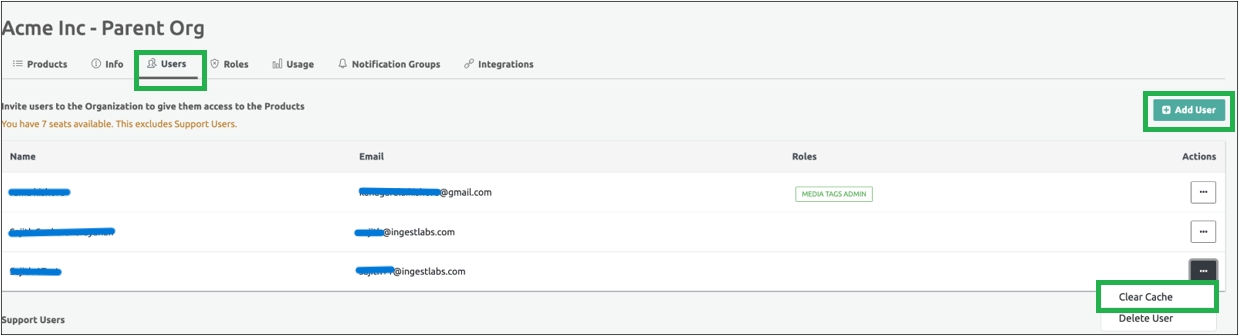
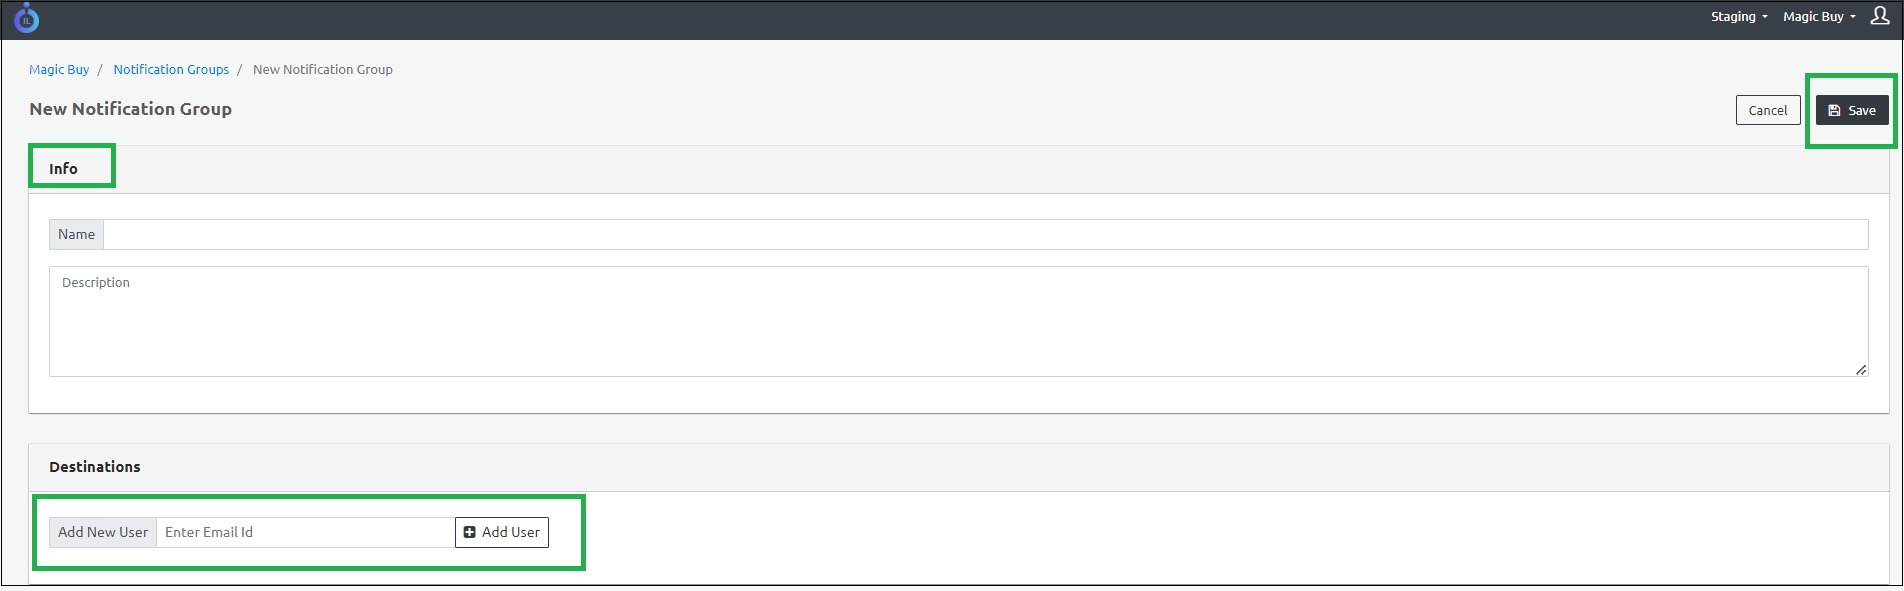
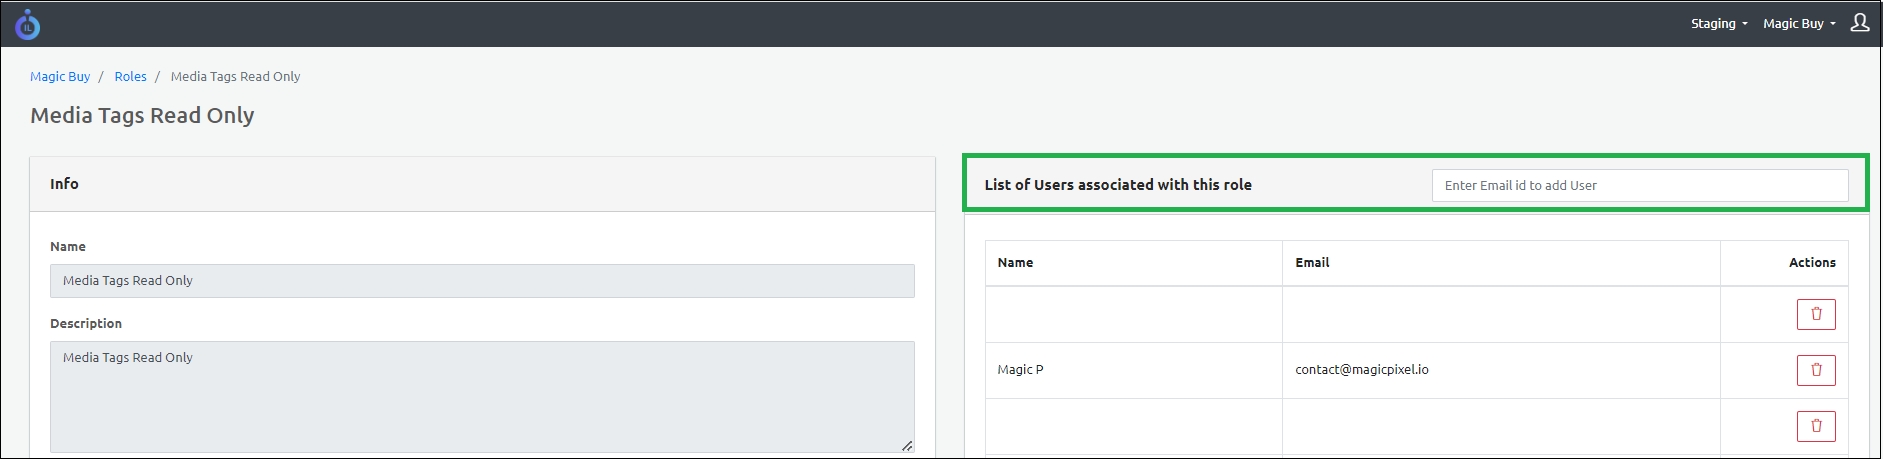
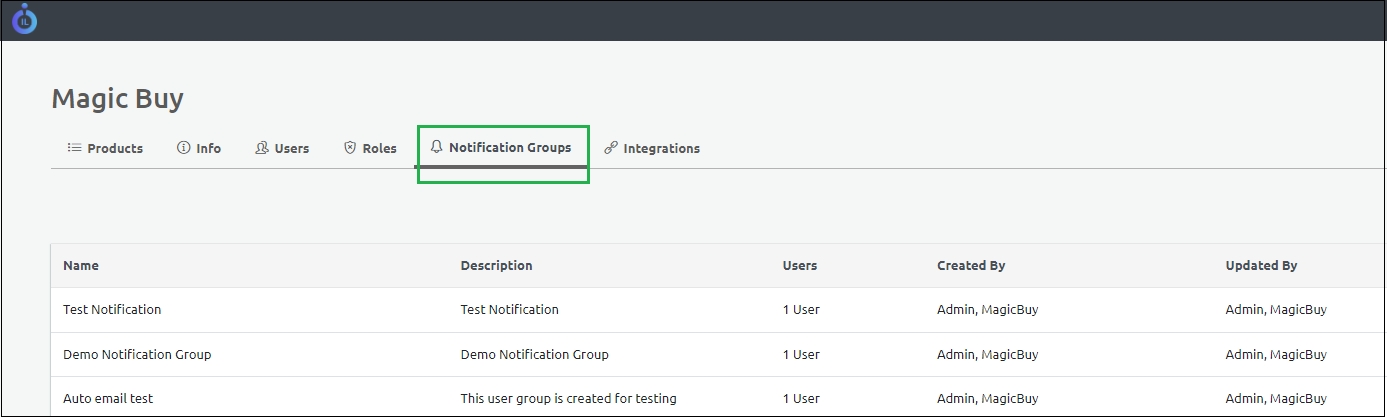
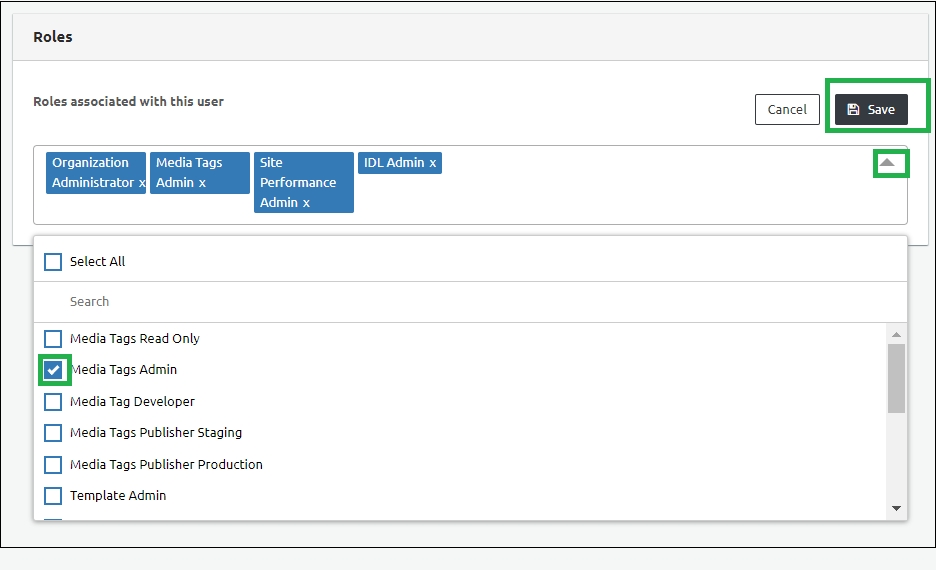
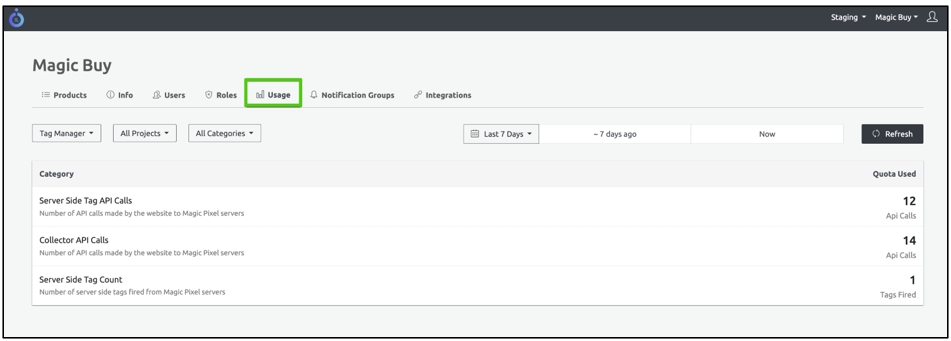
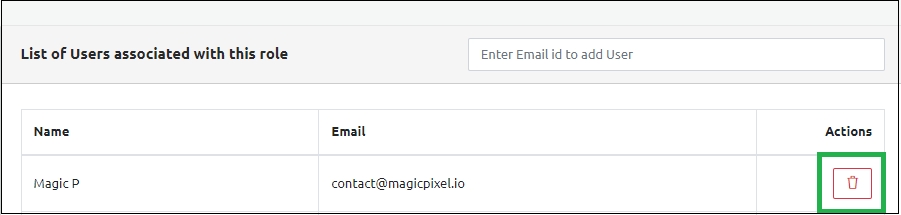
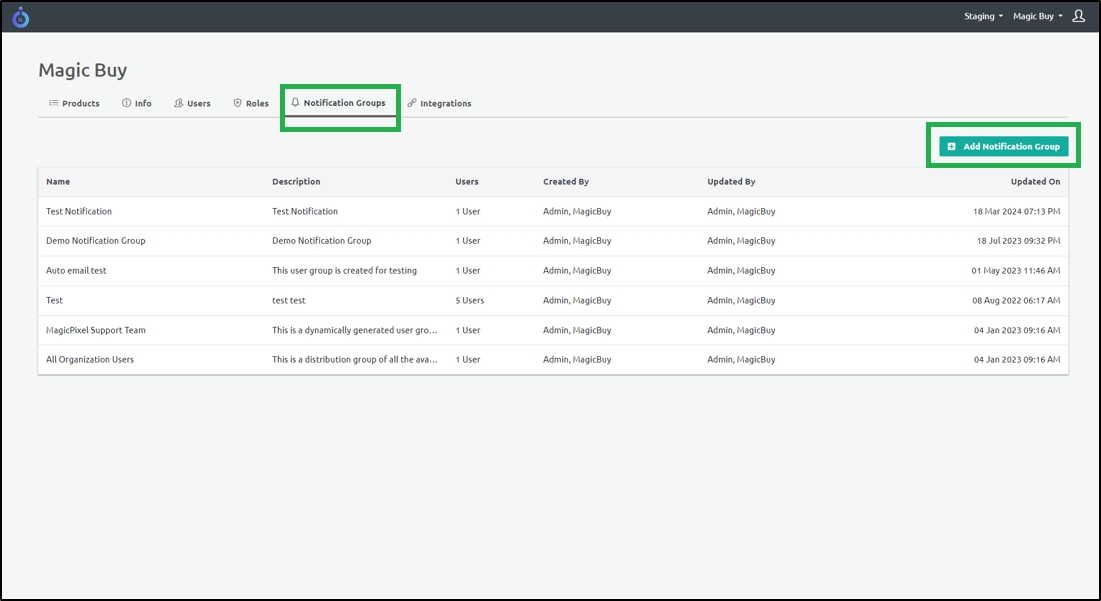


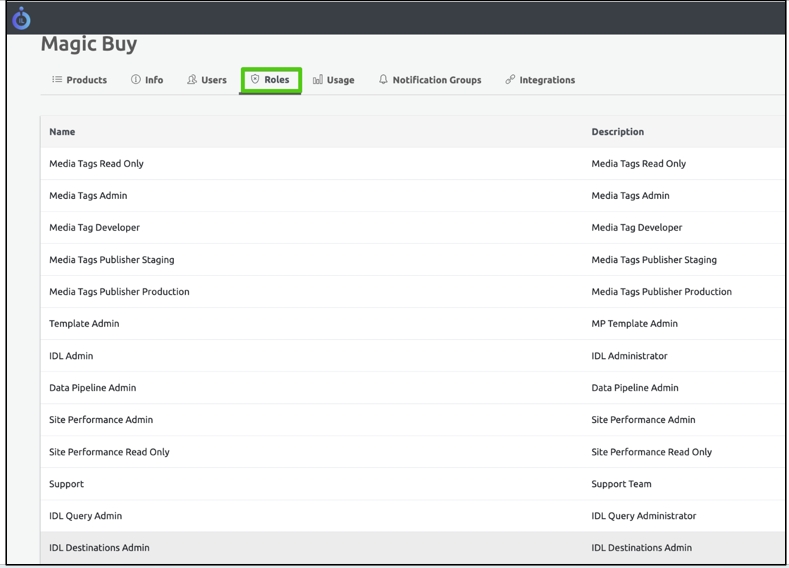
You can delete a particular Provider using this option.
To delete a Provider, perform the following steps:
Step 1: Select the Provider that you want to delete.
Step 2: From the Actions drop-down menu on the top right corner, select Delete.
Step 3: A dialog box appears with the message: Do you wish to proceed?"
Click Yes to confirm and delete the Provider.
Step result: The Provider is deleted successfully.
Note: You cannot delete a provider that includes provider dependencies with the other attributes. Only after deleting the dependent categories, you can delete the Provider successfully.
Even after deleting the dependencies, if you cannot delete the Provider, then you must Publish the relevant categories first and then perform the delete operation.