Loading...
Loading...
Loading...
Loading...
Loading...
Loading...
Loading...
Loading...
Loading...
Loading...
Loading...
Loading...
Loading...
Loading...
Loading...
Media Data Platform Dashboard
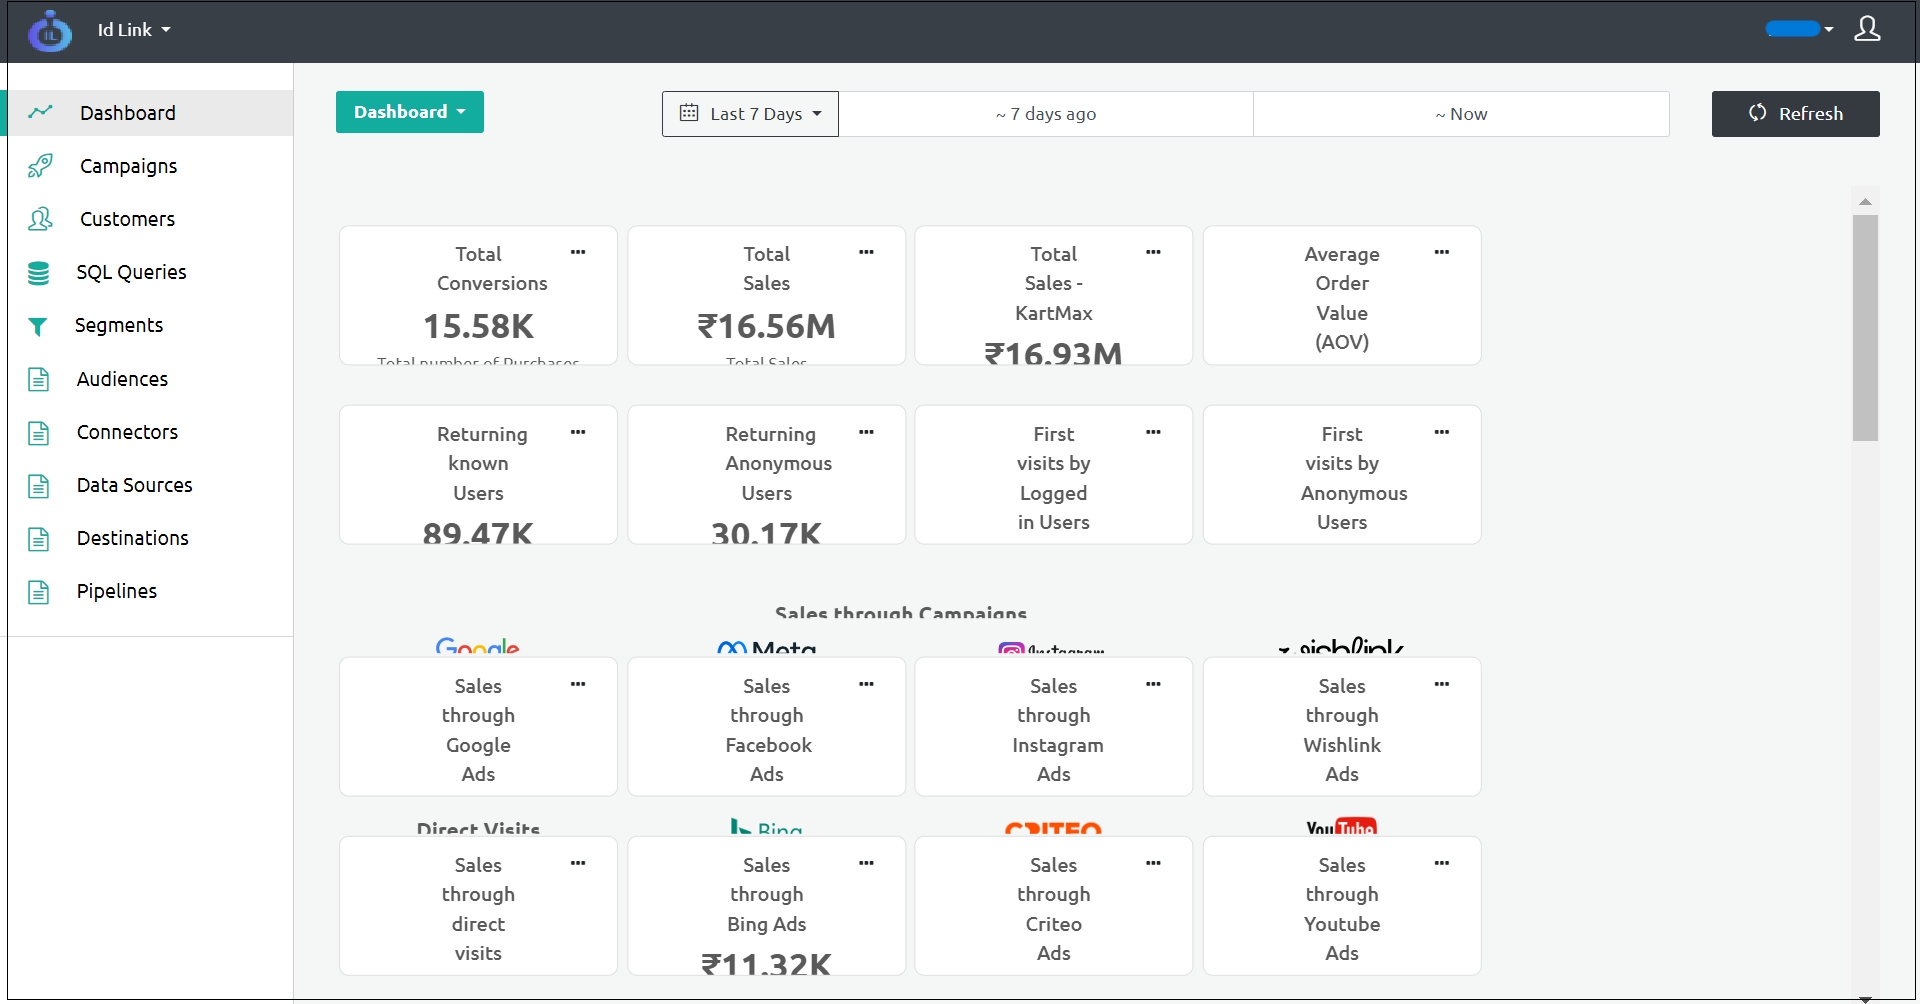
The Media Data Platform (MDP) Dashboard visually represents the customer data when you log in to the MDP. It displays the conversion data using customizable dimensions and metrics. Conversion refers to the conversion of a prospective customer into an actual customer. Ingest Labs creates a default dashboard for the new MDP users soon after the users are onboarded.
The Dashboard screen is customisable and can include the following details:
Total Conversions
Total number of conversions (for example, purchases)
Total Sales
Total sales value
Total Sales - KartMax
The total sales or conversion value in Kartmax
Average Order Value (AOV)
The average value of the conversions or the orders
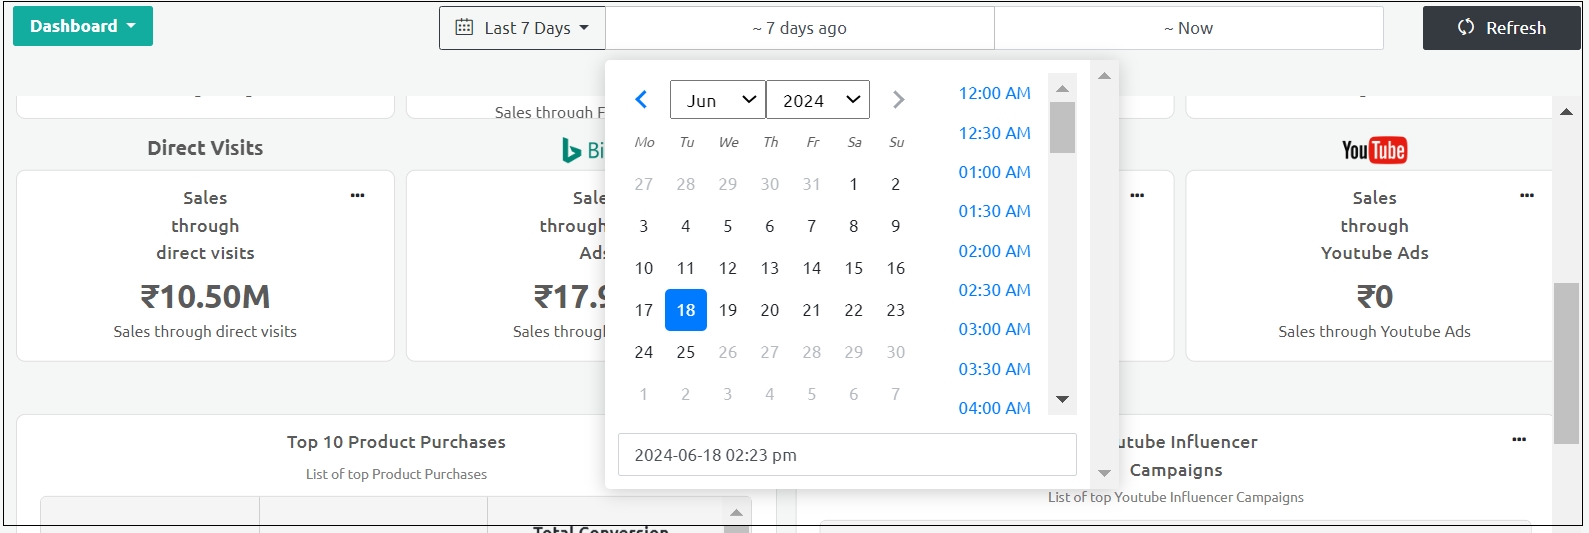
By default, the Dashboard is set to display the data for the last 7 days. To view the data for a different time duration, you must set the time range from the Last 7 days tab on the top of the page and click Refresh.
To view the data for a custom duration, select the start date from the 7 days ago tab and the ‘end date’ from the Now tab at the top of the screen and click Refresh.
Returning Users
Registered and unregistered users who repeatedly access the website
First visits by Users
First visits by registered and unregistered users
Sales through Campaigns
Total sales through various ad campaigns on Google, Meta, Instagram, Wishlink, Bing, Criteo, YouTube, and others.
Sales through Direct Visits
Total sales registered through direct visits (without referral campaigns)
Top 10 Product conversion
List of products purchased, number of people purchasing the products, total value of the purchase
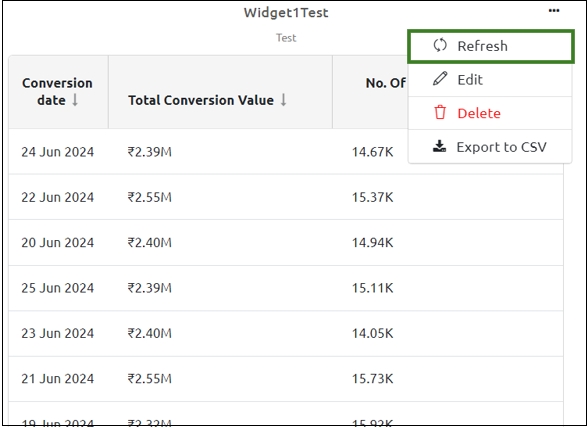
You can update the information in a widget by refreshing the widget.
Perform the following steps to refresh a widget:
Click Dashboard from the left navigation panel and navigate to any of the widgets in the dashboard.
Click the three dots at the top of the widget.
Click Refresh.
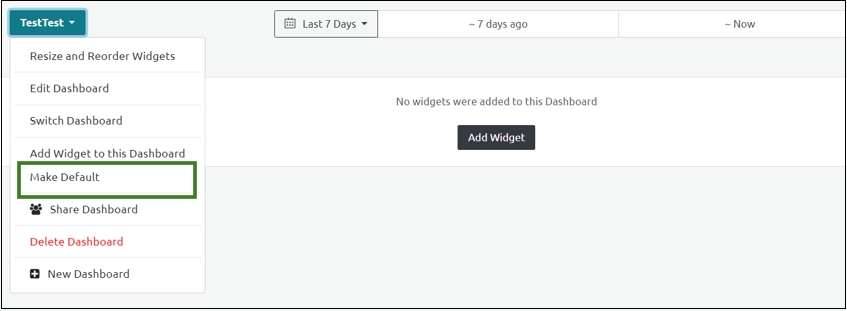
You can make a newly created dashboard the default dashboard. Select Make Default from the newly created dashboard drop-down menu.
The Dashboard is marked as default.
To revert the changes, select Remove as Default.
Note: You must be authorized to perform this action. The Default Dashboard created by Ingest Labs cannot be edited. You can create another dashboard and make it the default dashboard.
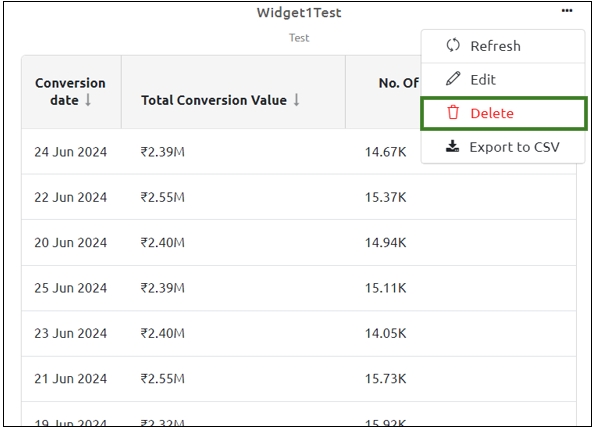
You can delete a widget using this option.
Perform the following steps to delete a widget:
Click Dashboard from the left navigation panel.
Navigate to any widget that you want to delete. Click the three dots at the top of the widget.
Click Delete.
In the confirmatory dialog box that appears, click Yes.
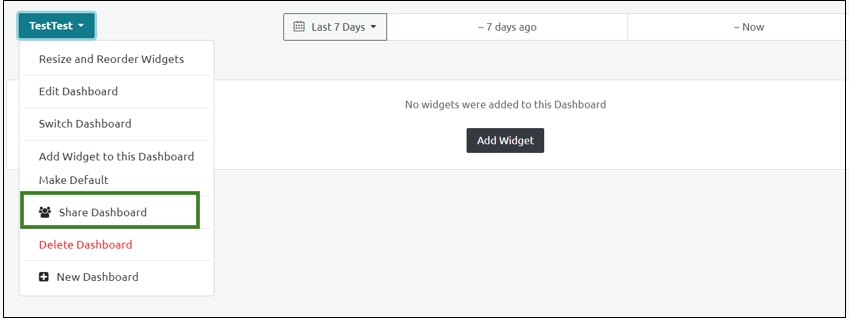
You can share the dashboard with multiple users.
Perform the following steps to share the Dashboard with other users:
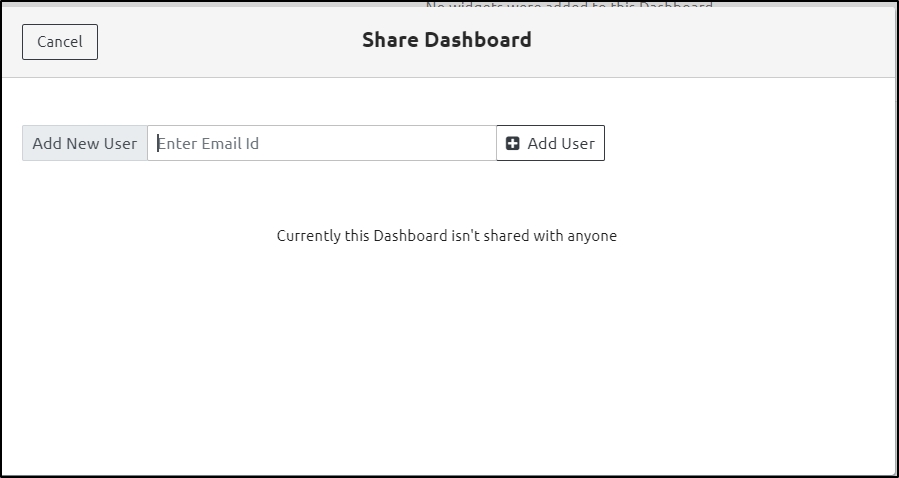
Select the Share Dashboard option from the newly created dashboard option.
Enter the e-mail ID in the Add New User field and click Add User.
Enter a valid email ID to save the user details and display the following success message:
Note: A notification is triggered to the users about the dashboard details.
Click the Delete icon against the user's e-mail ID to stop the user from sharing the dashboard.
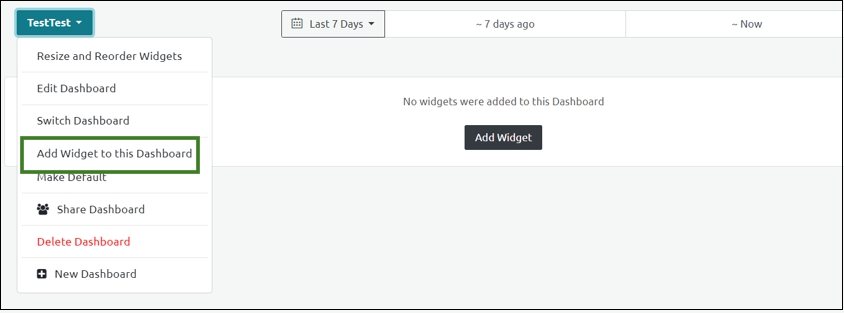
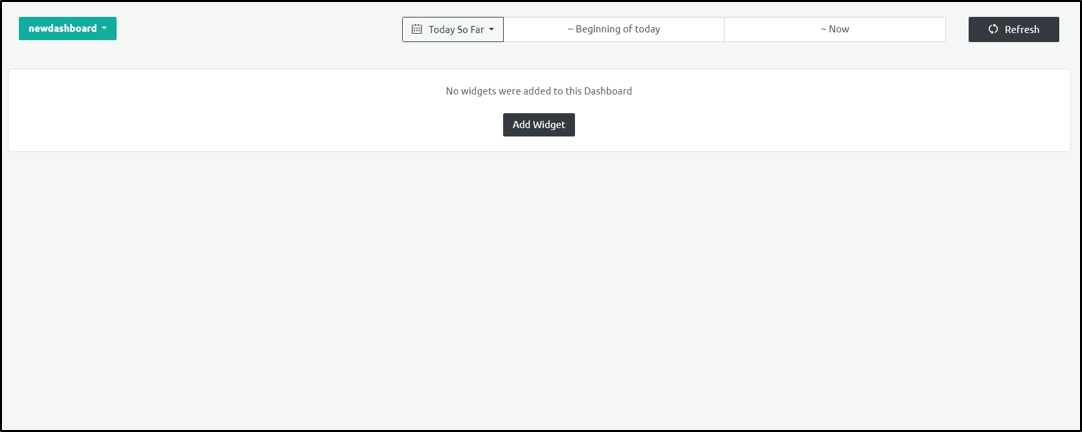
From the new dashboard that is created, you can add new widgets.
Select Add Widget to this Dashboard option from the newly created dashboard.
To add a new widget in the dashboard, follow the procedure "Add Widgets in the CDP Dashboard".
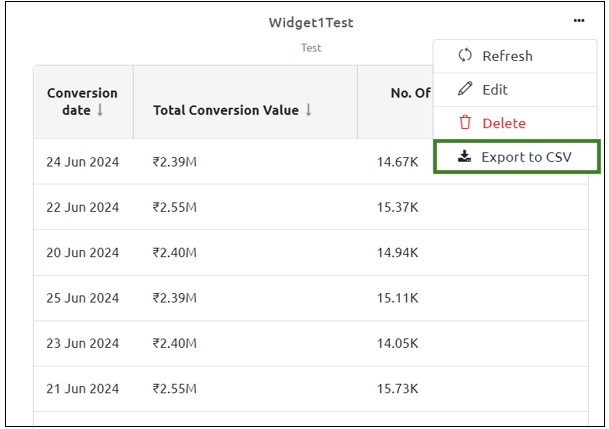
Export a Widget to CSV
You can export the information in a widget to the CSV format using this option.
Perform the following steps to export a widget to CSV:
Click Dashboard from the left navigation panel.
Navigate to any widget that you want to export. Click the three dots at the top of the widget.
Click Export to CSV
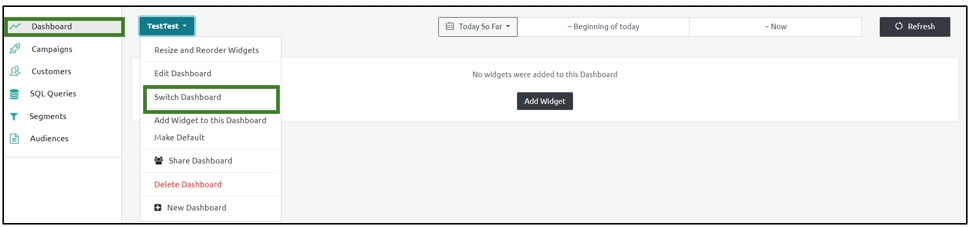
You can change the Dashboard and revert to the Default dashboard.
Perform the following steps to switch the Dashboard.
From the new Dashboard, select the Switch Dashboard option.
Click the Project's Default Dashboard option on the Dashboard screen.
Step Result: The default dashboard appears on the screen.
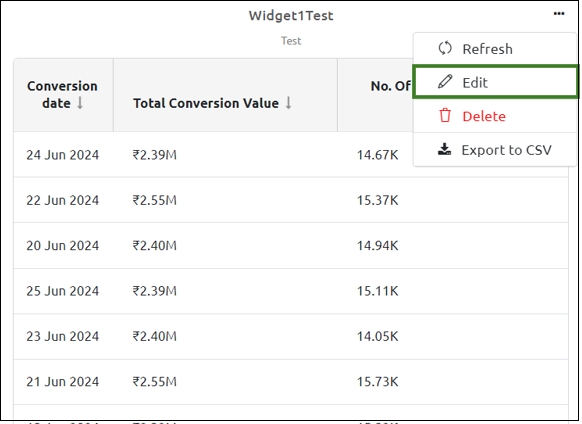
You can edit the information in a widget, edit the context, dimensions, and the metrics.
Perform the following steps to edit a widget:
Click the three dots at the top of the widget.
Click Edit. Edit the widget info section, the customize section, and the segment and click Save to save the changes made to the widget.
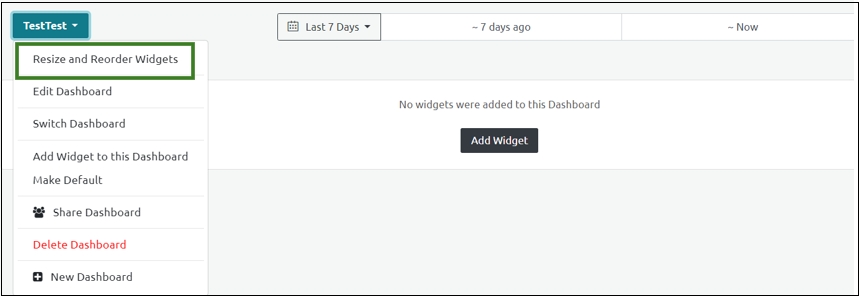
Perform the following steps to resize and reorder the widgets in the dashboard:
Click Dashboard from the left navigation panel.
From the Dashboard drop-down menu, click Resize and Reorder Widgets.
Step Result: The New Dashboard screen appears.
The information in the widget gets exported to the CSV format and downloaded into your local system.
Note: You can export widgets in the Pivot Table format. You cannot export widgets that are in the Stack Area Chart or the Counter formats.
From the Default Dashboard, you can select and navigate to the specific Dashboard to display.
Resize the widget by taking your cursor to any of the corners or sides of the widget. Click and drag the arrow to the required size.
To reorder the widgets, click on the widget and place it anywhere on the page.
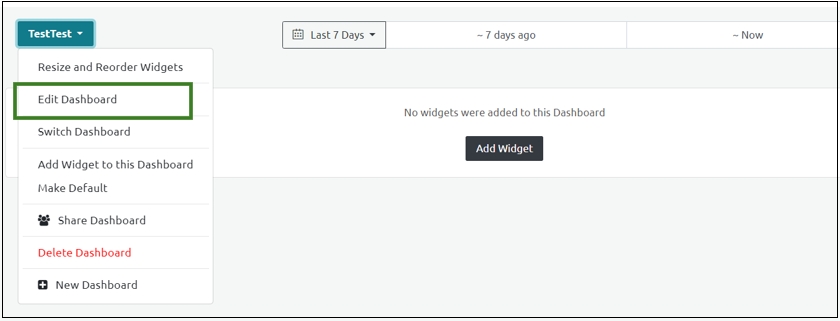
You can edit the Dashboard details of the newly created dashboard.
To edit the Dashboard details, perform the following steps:
Select Edit Dashboard from the newly created dashboard drop-down menu.
Edit the details in the Update Dashboard and click Save.
Step Result: The dashboard details are updated.
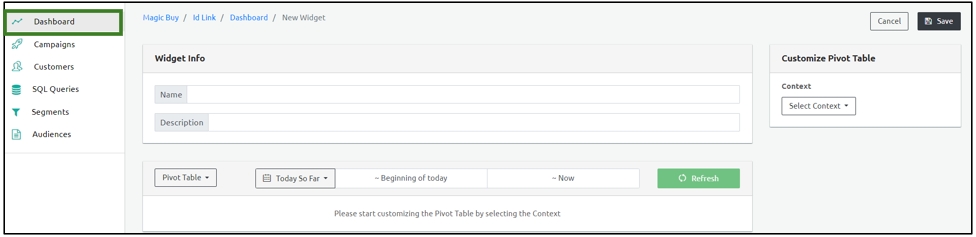
Perform the following steps to create a new dashboard:
Click Dashboard from the left navigation panel.
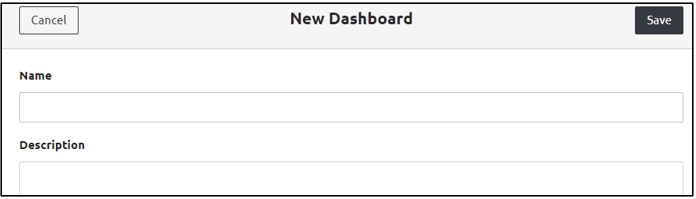
From the Default Dashboard drop-down menu, click New Dashboard.
Step Result: The New Dashboard screen appears.
Enter the Name and Description in the relevant fields.
Note: Ensure that the number of characters in the name field is five or more. Else the following message appears: Name must be longer than or equal to 5 characters.
Click Save to save the changes.
Step Result: The new Dashboard is added successfully.
Note: You cannot edit the Default Dashboard as the project is configured with the default settings.
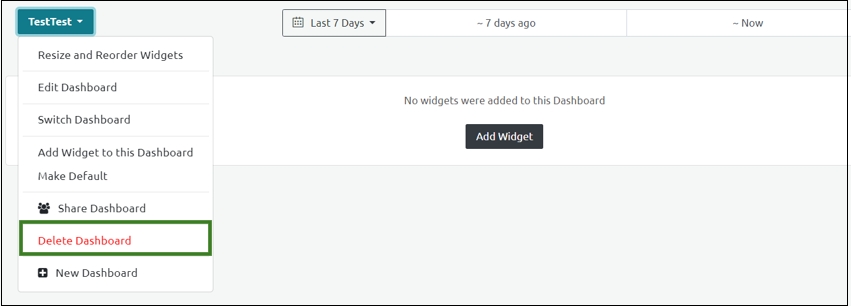
You can delete the newly created dashboard using this option.
To delete the dashboard, perform the following steps:
Select Delete Dashboard from the newly created dashboard drop-down menu:
In the confirmatory dialog box that appears, click Yes.
Step Result: The Dashboard is deleted successfully along with the widgets.
Perform the following steps to create widgets in the Dashboard:
Follow the procedure provided in Create a New Dashboard to create a new dashboard.
Click Add Widgets.
Add the name and the description of the widget.
Select one of the following visuals from the dropdown menu to configure the data format:
Pivot Table - Displays the conversion data in a tabular format.
Counter - Displays the total value of conversions.
Stacked Area Chart - Displays the conversion data for a custom duration using a visual line chart.
Select the duration of the required data. You can select to view data from upto a month ago. You can also select a custom range.
Use the right vertical panel to customize the data. You can select the context, the dimensions and metrics and also customize the columns and the rows of the data table.
A. Context: Select one of the following contexts from the Context drop-down menu:
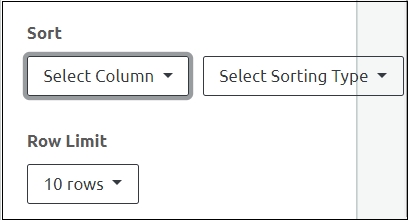
Sort: In the Sort section, use the dropdown menus to select the column to be sorted using the ascending or descending order. Select the number of displayed rows from the Row Limit Dropdown menu.
Enter the Widget Name and Description under the Widget Info section and click Save.
Step Result: The new widget is added successfully.
As per the current filter conditions applied, the information displayed on the Dashboard screen is for a default period. You can specify a time range to display the information and click Refresh.
Perform the above steps for the Counter and Stacked Area Chart.
Orders
Select this for conversion value, purchase item, and number of conversions.
Conversion Comparison with CRM Data
Select this for conversion date, count and value, data source, and sales channel.
User Visits Stats
Select this for visit date and type, App Type, and total users.
B. Dimensions and Metrics: Select the Dimensions and the Metrics for each context. Select the checkboxes under Dimensions. Dimensions are independent data points received from the data collected. Metrics are generated from the data collected. For every context, you can select any combination of dimensions and metrics.
Context-based Dimensions and Metrics
i. Conversion Events: You can select the following dimensions for this context:
Conversion Source Channel
Select this option to display the conversion channel such as web or app.
Browser
Select this option to display information regarding the Browser type such as Chrome, Safari, Edge, IE, Firefox, Opera, and Other.
Operating System
Select this option to display information regarding the Operating System.
Device Form Factor
Select this option to display the information regarding the device type such as Desktop, Mobile, or Tablet.
Language
Select this option to set the preferred language. The available languages are English, Spanish, and Other.
UTM Source
Select this option to display the UTM Source such as adyogi, wishlink, and others.
You can select the following metrics for this context:
Total Conversion Value
Select this option to display the total conversion value
Average Conversion Value
Select this option to display the average value of all the conversions.
No. Of Conversions
Select this option to display the total number of conversions.
No. Of Conversions - Last Touch
Select this option to display the total value of all the conversions.
Total Users
Select this option to display the total number of users
Average Sales Time
Select this option to display the average time taken for a sale.
ii. Orders: You can select the following dimensions for this context:
Conversion Date
Select this option to display the exact date of the conversion.
Purchase Item
Select this option to display the code number of the purchased item.
You can select the following metrics for this context:
Total Conversion Value
Select this option to display the Total Conversion Value.
Number of conversions
Select this option to display the total number of converted users.
iii. Conversion Comparison with CRM: You can select the following dimensions for this context:
Conversion Date
Select this option to display the Total Conversion Value.
Data Source
Select this option to display the data source of the conversion such as the CRM or Ingest Labs.
Sales Channel
Channel used for the sales such as app or web.
You can select from the following metrics for this context:
Total Conversion Value
Select this option to display the Total Conversion Value.
Total Conversion Count
Select this option to display the total number of converted users.
iv. User-Visit Stats: You can select the following dimensions for this context:
Visit Date
Select this option to display the date of the user's visit.
User Visit Type
Select this option to display the first and the returning visits of registered and anonymous users.
App Type
Select this option to display if the user uses the app or web for the website visit.
You can select the following metrics for this context:
Total Users
Select this option to display the total number of users in the selected dimensions.
Conversion Events
Select this for conversion data like conversion value, date, number, UTM source, medium, term, sales campaign, and browser.
UTM Medium
Select this option to display the UTM Medium such as Instagram, wishlink, and others.
Campaign ID
Select this option to display the Campaign ID.
Campaign Referrer Domain
Select this option to display the Campaign Referrer Domains like Instagram, Wishlink, Facebook, Google, and others.
User Visit Type
Select this option to display the user visit types such as returning logged-in users, returning anonymous users, first-time logged-in users, and first-time anonymous users.
Creative Name
Select this option to display the creative name of your website.